Unify and query private network data in Grafana Cloud: Private Data Source Connect is now GA
With Private Data Source Connect, Grafana Cloud users can now query data in multiple private networks through a secure link.
Read more
With Private Data Source Connect, Grafana Cloud users can now query data in multiple private networks through a secure link.
Read more
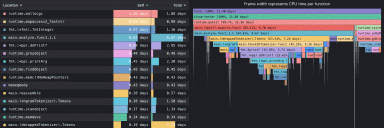
An inside look at how the Grafana Loki team used Grafana Cloud Profiles to improve code performance by more than 30% for a new feature.
Read more
Due to an ARM-specific bug in the Go compiler, we will temporarily cease distributing any new 32-bit ARM versions of Grafana or Grafana Enterprise.
Read more
Grafana Labs partnered with Microsoft to develop Grafana updates that will help with the transition from Azure Active Directory Pod Identity...
Read more
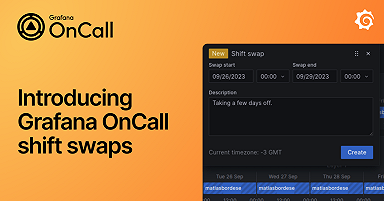
The new Grafana OnCall shift swaps feature makes it easier than ever for engineers to coordinate with teammates and exchange on-call shifts.
Read more
The Prometheus Java client 1.0.0 is here! Tune in to PromCon on Friday, Sept. 29 to find out how we added a blazing fast implementation of Prometheus...
Read more
We cover the architecture and end-to-end considerations that are involved for picking temporality for OpenTelemetry metrics.
Read more
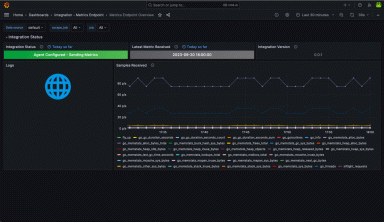
The Metrics Endpoint solution is an agentless integration you can use to forward Prometheus metrics from your publicly addressable host directly into...
Read more
Distributed Tracing in Grafana Cloud k6 correlates performance test results with server-side tracing data, allowing engineering teams to troubleshoot...
Read more
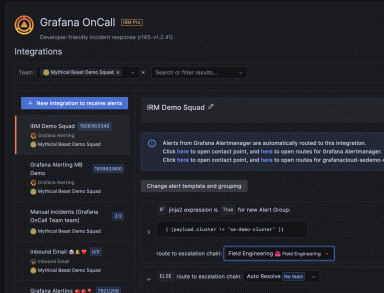
Discover what we've added to Grafana OnCall to support users at scale, including RBAC, cross-team linking, a PagerDuty migration tool, and more.
Read more
Sift, currently in public preview in Grafana Cloud, performs a set of automated system checks and surfaces potential issues in your Kubernetes...
Read more
Report span information for basic transactions as well as RED metrics for your Linux HTTP/S and gRPC services — all without requiring any code...
Read more
Grafana Scenes, a new frontend library that lets you build dynamic dashboarding experiences within Grafana apps, is now generally available.
Read more
Oh my grep — how Grafana 10 makes debugging issues easier with logging
Read more
There are several ways to provision a Grafana Alerting notification policy. Learn how to provision via an API and a configuration file with this...
Read more
