Save the date: GrafanaCONline 2022 blasts off on June 13
GrafanCONline 2022 will land on a screen near you June 13-17. The CFP is now open for Grafana Labs' biggest community event of the year.
Read more
GrafanCONline 2022 will land on a screen near you June 13-17. The CFP is now open for Grafana Labs' biggest community event of the year.
Read more
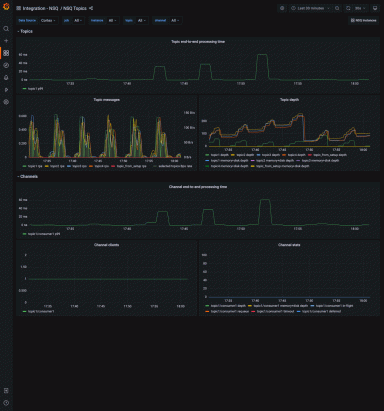
The NSQ integration for Grafana Cloud helps monitor the real-time distributed messaging platform at scale.
Read more
This tutorial explores various options to integrate performance testing into CircleCI with Grafana k6.
Read more
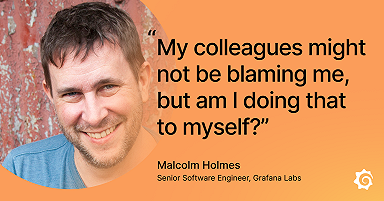
A no-blame culture allows Grafana Labs to build systems that can handle humans making mistakes, rather than berating them for not being perfect
Read more
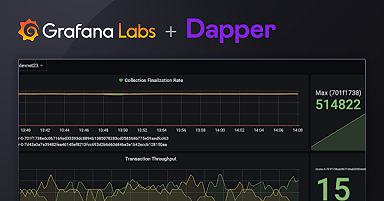
Learn how Grafana Loki, Grafana Tempo, and Grafana have saved the blockchain gaming studio time (and headaches), allows for proactive problem-solving,...
Read more
Tips and tricks for using the new full-range log volume functionality in Grafana, which allows users to see a histogram of their log distribution over...
Read more
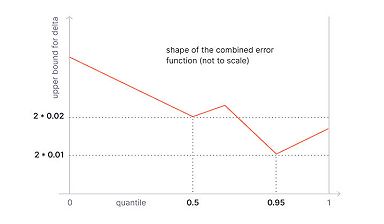
An in-depth look at the CKMS algorithm and how it works with summary metrics in Prometheus.
Read more
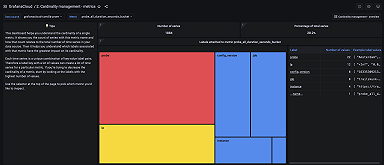
Grafana's cardinality dashboards gives users the ability to analyze cardinality data from a broad to a more targeted view.
Read more
Learn more about the Promtail Kafka Consumer and how you can get started with sending Kafka messages to Grafana Loki.
Read more
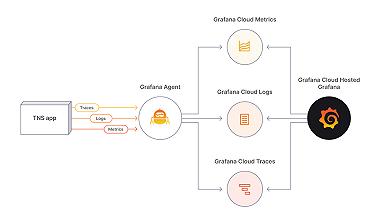
Exemplars in Grafana Cloud Metrics allow users to seamlessly jump from metrics to traces at cloud native scale
Read more
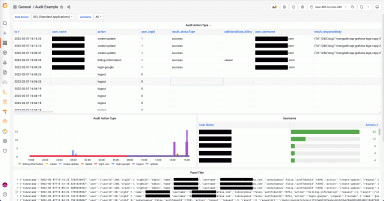
Learn more about Grafana's security features for authentication, authorization, auditing, administration, and encryption.
Read more
Grafana Labs' senior engineering manager Mihaela Minor works on the Grafana Experience team ensuring seamless experiences and workflows with Grafana...
Read more
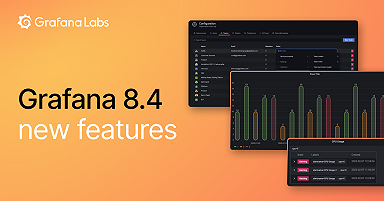
Grafana 8.4 is easier to use, introduces new panels, runs faster queries, offers enhanced security features, and more. Download the latest version...
Read more
Grafana k6 launched k6 Cloud for Education, a program that includes a free k6 Cloud account to help teach performance testing.
Read more
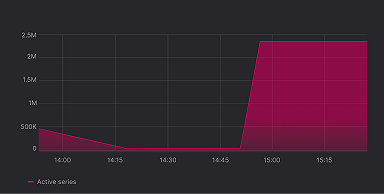
What causes cardinality spikes and why cardinality matters in your observability strategy.
Read more
