Service level objectives: How SLOs have changed the business of observability
A new "Grafana's Big Tent" podcast episode reveals how SLOs have shaped Grafana Cloud and the business of observability.
Read more
A new "Grafana's Big Tent" podcast episode reveals how SLOs have shaped Grafana Cloud and the business of observability.
Read more
Grafana Labs has reviewed our code base, issues, projects, vulnerabilities, libraries, and licenses, and we found no evidence that we have been...
Read more
Learn how to set up Grafana Mimir, add recording rules and alerts, and how Grafana Mimir handles an outage.
Read more
One man's personal garden bot helped inspire a business that uses Grafana to monitor data that is revolutionizing farming and increasing yields.
Read more
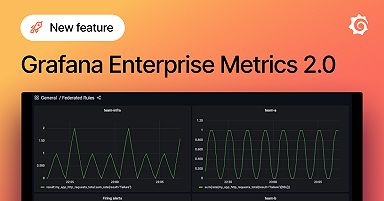
In Grafana Enterprise Metrics 2.0, you can create a single rule group that uses data from multiple tenants with the new cross-tenant alerting and...
Read more
Today we are releasing Grafana Enterprise 8.4.6 which includes an important high severity security fix. If you are affected, we recommend that you...
Read more
Grafana Loki 2.5 delivers optimized performance, new ways to ingest logs, removes S3 rate limits, and more.
Read more
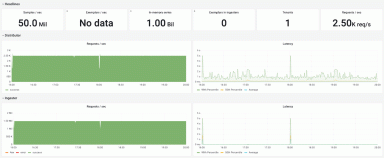
To make sure that Grafana Mimir could support such a high scale of metrics, we performed extensive load testing and optimized performance where we...
Read more
We're grateful to our investors, our team of Grafanistas, and our community of users and customers.
Read more
With the WebSockets plugin, you can use a Grafana panel to get immediate feedback on the health of your devices.
Read more
Listen to Grafana Labs' new observability podcast where we discover the amazing personalities, innovative products, and surprising projects shaping...
Read more
Grafana Labs experts will host live weekly webinars in the Asia Pacific time zone to walk through the latest Grafana features and improve your...
Read more
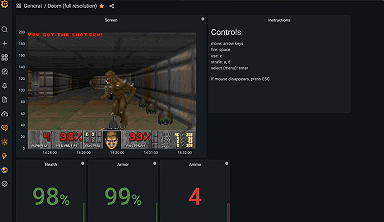
Using time series panels and Grafana Live streaming, Doom fans can now pursue total annihilation on Grafana.
Read more
Grafana Labs' new open source project, Grafana Mimir, allows you to scale to 1 billion metrics and beyond.
Read more
With the launch of our new open source TSDB, we collected questions from Grafanistas and Raj answered them.
Read more


