How flame graphs visualize continuous profiling data in Grafana Phlare
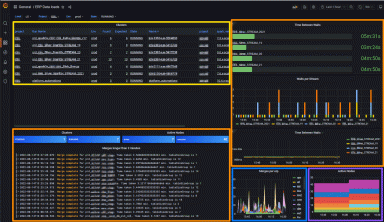
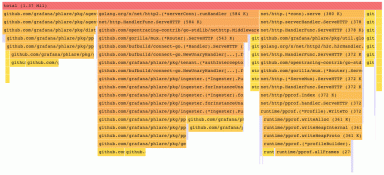
Flame graphs are a new visualization type in Grafana that helps you track resource consumption and optimize your application.
Read more
Flame graphs are a new visualization type in Grafana that helps you track resource consumption and optimize your application.
Read more
Read more
Read more
Read more
Grafana Tempo will take a big leap in the 2.0 release with TraceQL, a first-of-its-kind query language to help you find the exact trace you're looking...
Read more
Read more
Read more
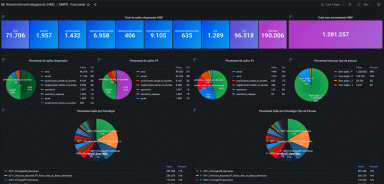
Latin America's biggest bank relies on Grafana for better insights into the performance of infrastructure and applications hosted on premises and in...
Read more
Read more
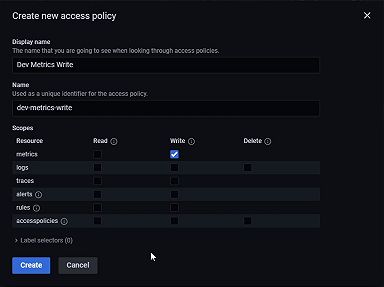
Cloud Access Policies in Grafana Cloud give you more control over privileges, helping to reduce vulnerabilities and limit the impact of developer...
Read more
Read more
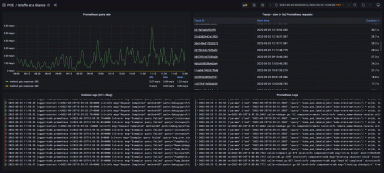
Medallia's Performance and Observability Engineering team relies on Grafana to unify observability and optimize internal users' experience.
Read more
Adform centralized its observability system on Grafana so developers can choose their preferred tools and the DevOps team can have the oversight it...
Read more
Read more
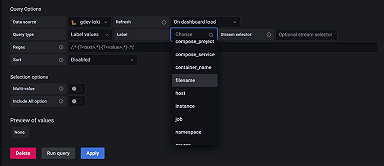
No exact syntax required! The Grafana Loki query variable editor provides an easy drop-down menu to choose between data sources in Grafana.
Read more
