Introducing the Grafana k6 Champions Program
Read more
Read more
Read more
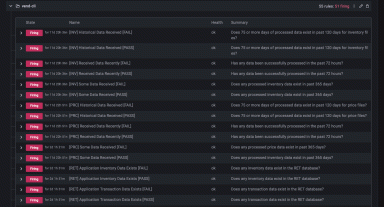
Torqata uses Grafana Alerting to quickly onboard tire retailers so they can share data and make better business decisions.
Read more
The Grafana Agent v0.30 introduces Loki components for building logging pipelines and marks Flow mode as beta!
Read more
Grafana Labs' new Helm chart for Loki is intended to supplant the six other existing charts. This will alleviate confusion and help the community...
Read more
Read more
Read more
KCB Bank Uganda uses Grafana to track the status of its services and systems at a granular level, which helps to improve service uptime for its...
Read more
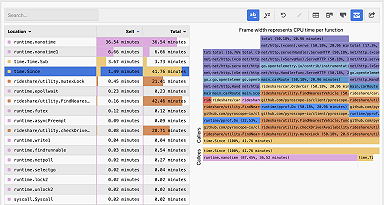
Learn how to use sandwich view mode for flame graphs to discover performance issues.
Read more
Read more
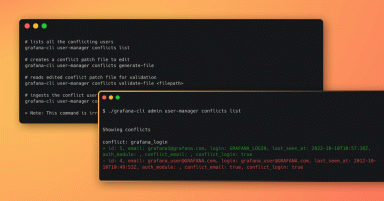
Our new command in Grafana CLI helps you resolve logins or emails that have case-insensitive conflicts.
Read more
Read more
Read more
Read more
Read more
