Grafana 10.1 release: Enhanced flame graphs, new geomap network layer, and more
Improved flame graphs, new geomap network layer visualization, and much more. Grafana 10.1 is here!
Read more
Improved flame graphs, new geomap network layer visualization, and much more. Grafana 10.1 is here!
Read more
In response to an incident in which our GPG private key was unintentionally exposed, we have issued a new public key. If you are affected, we...
Read more
Learn how the Grafana Cloud Logs engineering team overcame some recent performance and reliability challenges related to object storage rate-limiting....
Read more
Mark your calendar for ObservabilityCON 2023, taking place 14-15 November in London. It’s the premier, in-person observability conference you don’t...
Read more
By avoiding inverted index lookups in the Prometheus TSDB, Mimir's memory usage was reduced by up to 64%.
Read more
When we interview for backend engineering positions here at Grafana Labs, we focus on so much more than high-quality code.
Read more
Learn how Grafana and ClearML simplify the process of managing and monitoring machine learning models in production, and help developers quickly...
Read more
The new Grafana Champions Program recognizes and celebrates those who make a difference in the Grafana open source community.
Read more
Find out how DHL Switzerland radically transformed their stack to reduce MTTR and make a smooth migration to the public cloud.
Read more
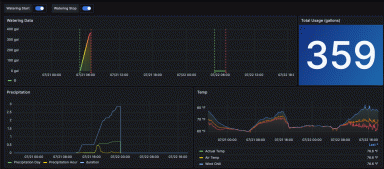
Follow along to learn how you can pair Grafana with mechanical and smart devices to help ensure your pool volume stays where it needs to be, rain or...
Read more
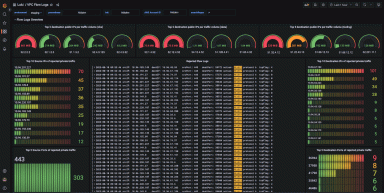
A switch from Elasticsearch to Grafana Loki let a company stay on top of networking incidents and search through hundreds of gigabytes of logs in...
Read more
To unlock the full potential of Grafana k6, it’s important to first understand the key features and underlying design of the open source load testing...
Read more
Correlating continuous profiles with metrics, logs, and traces in the Grafana Cloud observability stack gives teams new ways to improve application...
Read more
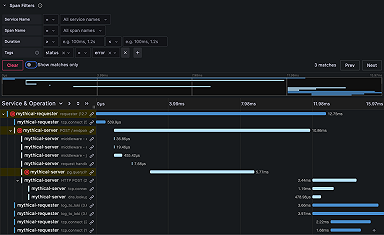
It's easier than ever to work with distributed tracing in Grafana. Learn how span filters and improvements to the trace view header and configuration...
Read more
Curious to try Adaptive Metrics? Here are some common questions users have when first trying the new metrics management tool in Grafana Cloud.
Read more


