Grafana 10.2 release: Grafana panel title generator, interactive visualizations, and more
Grafana 10.2 delivers exciting new visualization capabilities, AI assistance with dashboard titles, and more
Read more
Grafana 10.2 delivers exciting new visualization capabilities, AI assistance with dashboard titles, and more
Read more
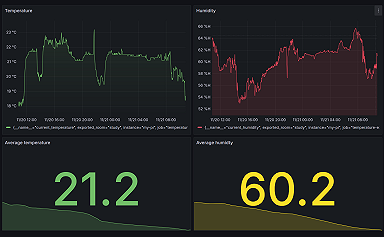
Whether you’re in a data center, a greenhouse, or a sea-side apartment, you can use Grafana dashboards to track temperature and humidity levels.
Read more
When winter is coming, Flexcity isn't worried because they have Grafana Cloud to visualize and monitor real-time energy consumption.
Read more
Grafana k6 v0.47.0 is here, introducing binary metadata support in the k6 gRPC module, Docker images for ARM64 architecture, and other exciting new...
Read more
The dynamic nature of Kubernetes workloads can lead to unexpected costs if you don't manage your resources efficiently. Follow these best practices to...
Read more
Today we are releasing Grafana Image Renderer v3.8.3 which includes an important security fix. If you are affected, we recommend that you install...
Read more
Learn how to quickly and easily find the current value of a metric from a range in a Grafana dashboard.
Read more
With the xk6-disruptor extension, engineering teams can add fault injection capabilities to Grafana k6 to improve app reliability.
Read more
The contributions we’ve seen from the Grafana open source community over the years have been both impressive and inspiring — and we know we’re just...
Read more
Today we are releasing Grafana 10.1.5, 10.0.9, 9.5.13, and 9.4.17, which include a medium severity security fix. If you are affected, we recommend...
Read more
Looking for info about Grafana? Ask Grot! Our new AI-powered chatbot has been trained on Grafana Labs' projects and products (and we are always adding...
Read more
Learn how to use the AWS Distribution for OpenTelemetry (ADOT) to export AWS Lambda traces to Grafana Cloud Traces with Grafana Agent as an OTLP...
Read more
This new release marks the pinnacle of a year-long effort to achieve feature parity between Grafana Agent Flow mode and Grafana Agent Static mode.
Read more
There are lots of ways to embed Grafana dashboards into other web apps, but the number of choices can also lead to confusion. Learn about the...
Read more
Join the open source extravaganza! Connect with the global open source community, improve your skills, and make a lasting impact on projects you're...
Read more
