ObservabilityCON 2023: Everything you need to know
Whether you’re attending in person or plan to join us virtually for the keynote, here are some helpful details to get ready for ObservabilityCON 2023.
Read more
Whether you’re attending in person or plan to join us virtually for the keynote, here are some helpful details to get ready for ObservabilityCON 2023.
Read more
Learn how we switched from Cluster Autoscaler to Karpenter to more efficiently manage Kubernetes autoscaling on AWS.
Read more
The redesigned panel headers we rolled out earlier this year help accommodate the wide range of Grafana use cases that have emerged over the years.
Read more
Through a well-organized set of design elements, patterns, and guidelines, Saga establishes a shared visual language for all of Grafana Labs’...
Read more
Learn how the Grafana Labs engineering team upgraded Grafana Cloud databases to MySQL 8 using an incremental, staged approach that resulted in little...
Read more
Want to learn more about the latest trends in open source observability? Be sure to sign up for the livestream of the ObservabilityCON 2023 opening...
Read more
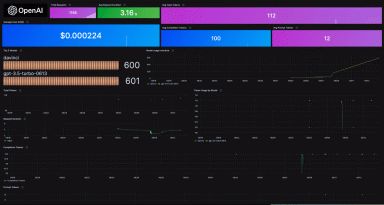
Monitoring OpenAI usage can help control costs, optimize resources, identify models, and more. Learn how to easily get started using Grafana Cloud's...
Read more
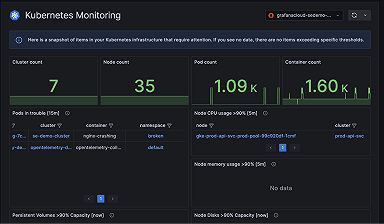
The latest developments in Kubernetes Monitoring in Grafana Cloud
Read more
Tempo 2.3 is here with blazing fast queries thanks to Tempo's new block format, vParquet3. This latest release also includes new TraceQL features and...
Read more
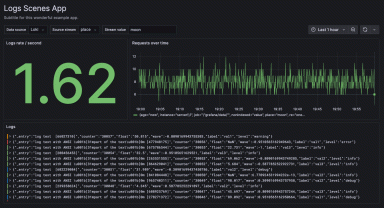
Learn how to harness the power of Grafana Scenes, Grafana Loki and Grafana plugin tools to create a dynamic application for querying and visualizing...
Read more
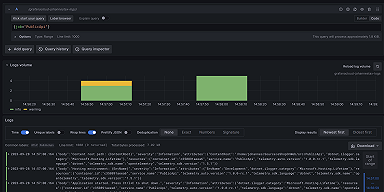
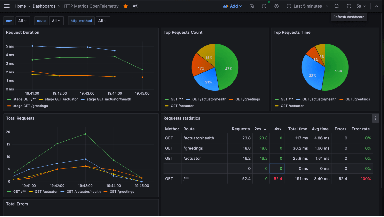
OpenTelemetry's .NET automatic instrumentation makes it easy to collect metrics, logs, and traces from your applications and visualize your OTel...
Read more
Learn how to integrate a Spring Boot application with Grafana using OpenTelemetry standards. And follow along by checking out practical examples in...
Read more
At KubeCon + CloudNativeCon North America, be sure to check out these four sessions featuring Grafana Labs experts and visit us at booth C18!
Read more
The all-new Grafana developer portal is a central hub of curated resources for developers who want to extend Grafana's capabilities.
Read more
While Grafana k6 browser can help measure the performance of frontend applications, it’s most powerful when complemented with real user monitoring...
Read more
