GrafanaCON 2024: In April, in Amsterdam, and in person!
GrafanaCON is back in Amsterdam and back in person! Learn more about our biggest community event of the year.
Read more
GrafanaCON is back in Amsterdam and back in person! Learn more about our biggest community event of the year.
Read more
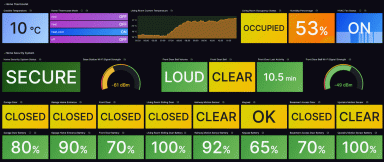
Find out how to use Grafana Cloud to visualize and monitor your home with smart devices.
Read more
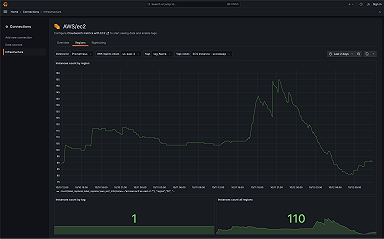
Take your AWS observability to the next level with Grafana Cloud. We now offer an EC2 solution that makes it easier than ever to monitor your AWS...
Read more
The upgrade to the Grafana 10.2.3 patch release should be treated as an upgrade to a minor version because there are breaking changes and new features...
Read more
What's in store for 2024? We predict what's in, what's out, and what will be the most exciting trends in open source observability.
Read more
Learn about how to become an engineering manager and get tips for being successful in the new role.
Read more
Learn how out-of-order ingestion works in Grafana Loki so you know what to expect when you need the log aggregation system to ingest older logs.
Read more
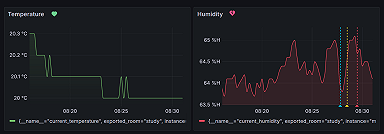
Follow this step-by-step guide to set up notifications in Grafana to monitor temperature and humidity sensor data.
Read more
Learn about life as a product designer at Grafana Labs, top tips for the job, and why communication is the secret to success.
Read more
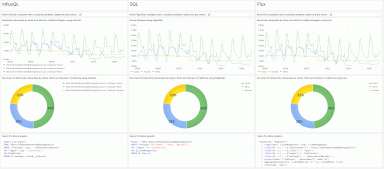
Before getting started with InfluxDB and Grafana — a powerful duo for data management and visualization — you need to choose between three query...
Read more
From creating a contact point to configuring notification policies, learn how to integrate Grafana Alerting and Telegram to receive alerts on the...
Read more
Learn how Grafana Loki executes queries and read about best practices and techniques that can improve your query performance.
Read more
How Grafana community members are using their dashboards for projects at work and at home
Read more
Check out some of the biggest updates we made to Grafana Cloud in 2023. From infrastructure to applications, we're making observability easier and...
Read more
From major releases to new projects like Grafana Beyla and Grafana Pyroscope, 2023 was a big year for OSS projects, and the open source community,...
Read more
