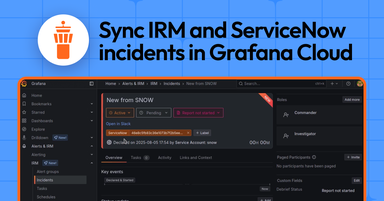
How to connect ServiceNow to Grafana Cloud IRM incidents
Learn the new way to set up webhooks based on Grafana Cloud IRM incident events so you can template URLs, headers, and data, as well as chain...
Read more
Learn the new way to set up webhooks based on Grafana Cloud IRM incident events so you can template URLs, headers, and data, as well as chain...
Read more
Grafana Labs was a proud sponsor of the HackUPC event, where students from around the world built some innovative, Grafana-powered dashboards to track...
Read more
See how Grafana Labs uses Grafana Assistant internally to find data, simplify queries, explain logs, accelerate onboarding, and improve dashboarding.
Read more
Quickly and easily find the alert rules you need with the new filtering experience in Grafana Alerting that provides a cleaner UI and more filtering...
Read more
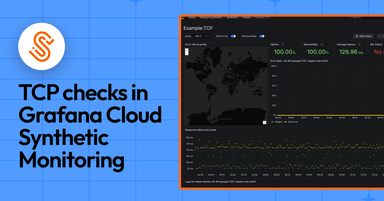
TCP checks in Grafana Cloud Synthetic Monitoring can be your first line of defense against service failures and network connectivity issues. Here’s...
Read more
Learn how putting all users in a single Grafana Cloud stack and managing access with teams, roles, and folders can help you and your organization stay...
Read more
See why tiger teams have become our go-to model for tackling urgent, high-impact issues that don't fit neatly into a single team's backlog, and get...
Read more
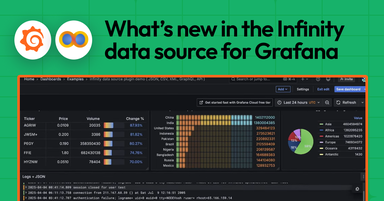
The latest updates to the Infinity data source for Grafana enhance its flexibility, performance, and compatibility with Grafana’s backend features.
Read more
You can now stream metrics into the AWS Observability app in Grafana Cloud in near-real-time thanks to our new integration with Amazon CloudWatch and...
Read more
Getting started with Grafana Cloud Frontend Observability? Here’s a breakdown of the key metrics and visualizations you’ll find on our pre-built...
Read more
Meet Project Bob, which aims to be the first autonomous boat to circumnavigate the globe, thanks, in part, to Grafana.
Read more
Check out the results of a Prometheus mentorship project focused on understanding how Prometheus handles OpenTelemetry resource attributes and how...
Read more
With HTTP Performance Insights in Grafana Cloud Frontend Observability, you can monitor your application’s HTTP requests and error rates to detect...
Read more
With our Voice of Customer program, we can tighten the loop between what our users ask for and what we prioritize in R&D. Here’s a look at some recent...
Read more
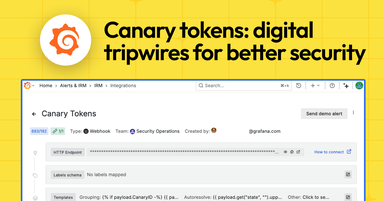
Learn why the use of canary tokens let us spot a recent intrusion and swarm quickly in response, and find out why you should be using canary tokens to...
Read more


