How to set up Grafana Mimir using Ansible
Learn how to use the Grafana Ansible collection to deploy and manage Mimir across multiple Linux host so you can explore your data in Grafana.
Read more
Learn how to use the Grafana Ansible collection to deploy and manage Mimir across multiple Linux host so you can explore your data in Grafana.
Read more
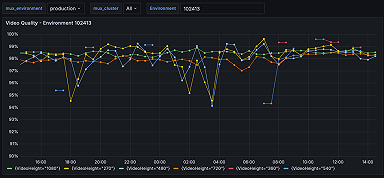
Learn how Mux is using Grafana Cloud for metrics, logs, and traces — and how they plan to extend their stack with Grafana Cloud K6, Grafana IRM,...
Read more
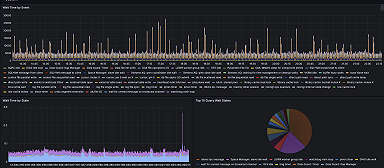
Learn how to use Prometheus and Grafana Cloud to build a free and flexible database monitoring solution.
Read more
Explore why monitoring LLM applications is so important and how you can do it more easily by using OpenTelemetry, Grafana Cloud, and OpenLIT.
Read more
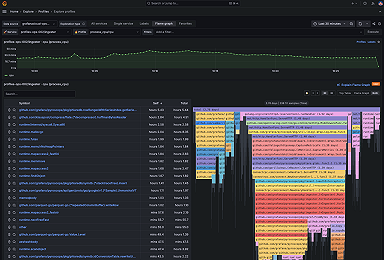
The Explore Profiles app provides a smooth, queryless experience to browse and analyze your profiling data. Here’s how to get started today.
Read more
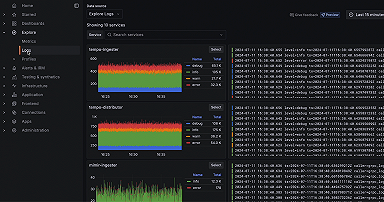
See how we're improving Explore Logs, an interface for quickly extracting insights from logs without needing to run a query, so you can identify...
Read more
From new troubleshooting tools in Kubernetes Monitoring to browser tests in Grafana Cloud k6, here’s a look at some of the latest and greatest...
Read more
Learn how to integrate performance testing into your development process with GitHub Actions and Grafana k6.
Read more
Join us on this journey to uncover the secrets of bird song and the power of observability, using open source tools like BirdNET, Prometheus, Grafana...
Read more
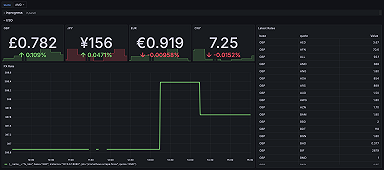
Discover how to use Grafana to track changes in foreign exchange rates so your money goes further when you travel.
Read more
Check out the agenda for ObservabilityCON 2024, a two-day conference kicking off in New York City on Sept. 24. Participate in hands-on sessions and...
Read more
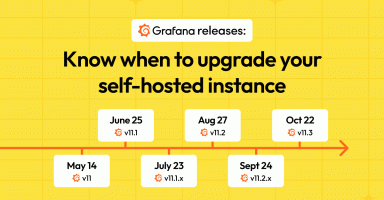
Map out your Grafana upgrades to fit your needs. Find out what to expect from the Grafana OSS and Grafana Enterprise releases, and when to expect...
Read more
If we shift our observability focus to the left, we can address issues in CI/CD before they escalate,
Read more
There are lots of ways to deploy Grafana Loki, but the Grafana Ansible collection might be the right choice if you're just starting out. Find out how...
Read more
Building your first Grafana dashboard? Here are some essential guidelines to craft something that’s both eye-catching and impactful for you and your...
Read more
