Grafana Labs acquires TailCtrl to accelerate development of Adaptive Traces for cost optimization
Grafana Labs has acquired TailCtrl, an early-stage company specializing in adaptive trace sampling.
Read more
Products
Grafana Cloud
Monitor, analyze, and act faster with AI-powered observability.
LGTM+ Stack
Key Capabilities
Observability Solutions
end-to-end solutions
Opinionated solutions that help you get there easier and faster
monitor infrastructure
Out-of-the-box KPIs, dashboards, and alerts for observability
visualize any data
Instantly connect all your data sources to Grafana
Grafana Cloud
Monitor, analyze, and act faster with AI-powered observability.
The actually useful free plan
10k series Prometheus metrics
50GB logs, 50GB traces, 50GB profiles
500VUk k6 testing
20+ Enterprise data source plugins
100+ pre-built solutions
Opinionated solutions that help you get there easier and faster
Instantly connect all your data sources to Grafana
Getting started with managing your metrics, logs, and traces using Grafana
Learn how to unify, correlate, and visualize data with dashboards using Grafana.
Grafana Labs has acquired TailCtrl, an early-stage company specializing in adaptive trace sampling.
Read more
All the latest updates announced at ObservabilityCON 2024 to simplify observability, save time and resources, and bring sophisticated new capabilities...
Read more
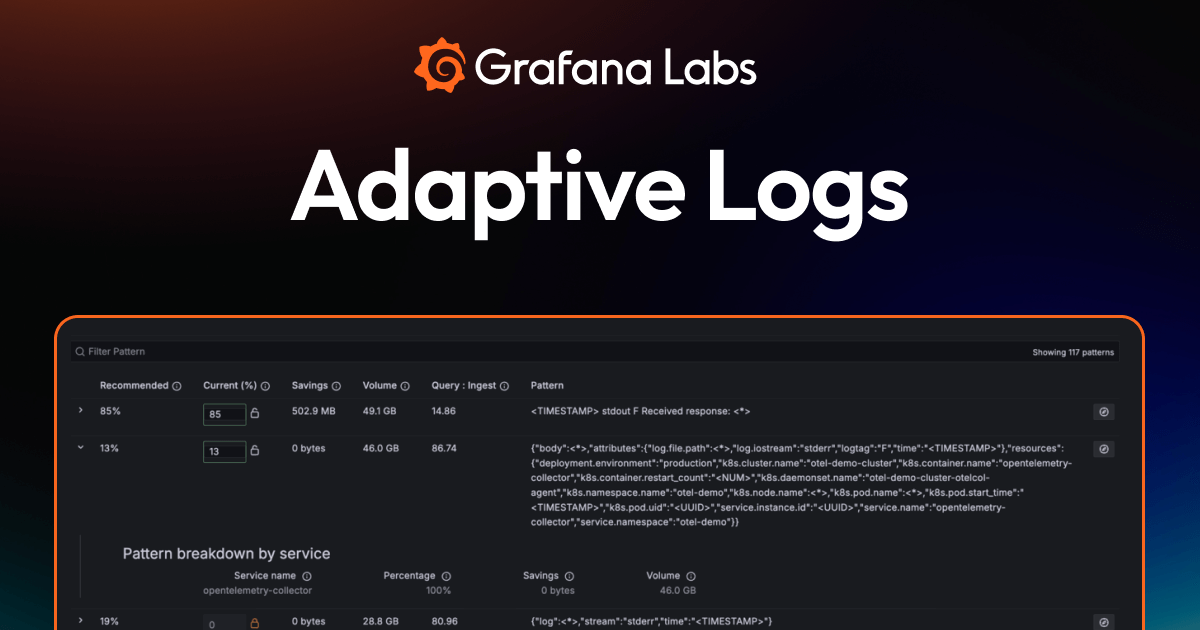
Adaptive Logs, a new Grafana Cloud feature, helps you lower your observability costs and cut down on noise by reducing the volume of unnecessary logs.
Read more
A new suite of unified workflows helps automate the correlation of anomalies across infrastructure and application layers and provides a more cohesive...
Read more
Introducing the Grafana Labs Startup Program, which offers up to $100,000 in Grafana Cloud credits to eligible startups for 12 months or until their...
Read more
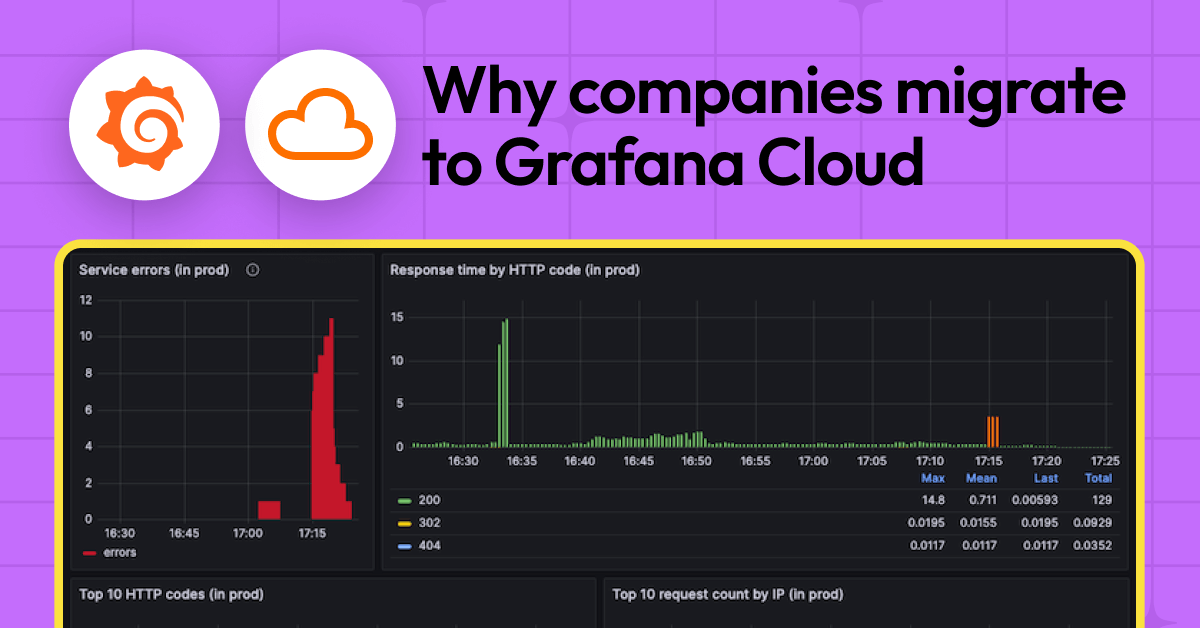
From cost savings to faster troubleshooting, here’s a look at some top reasons organizations decide to migrate to Grafana Cloud.
Read more
Listen to the latest "Grafana's Big Tent" podcast to learn why engineers at Cloudflare and Grafana Labs believe observability = control.
Read more
The Grafana OpenTelemetry distributions for Java and .NET are now generally available. See how we built them to be simple, safe, and cost-effective,...
Read more
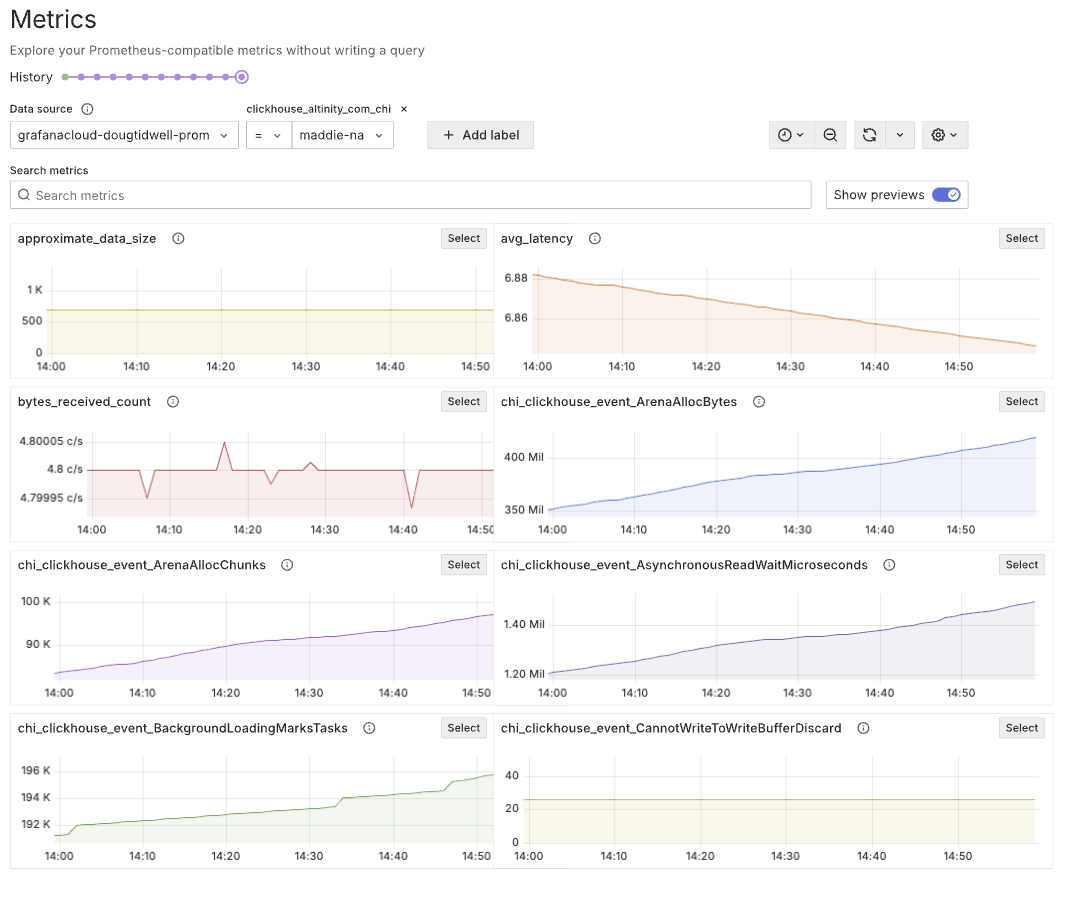
Learn how to use Altinity.Cloud with Grafana Cloud to visualize your ClickHouse data through Prometheus metrics and Loki logs.
Read more
Help the community get a better understanding of the state of observability. Take the Observability Survey today to share your thoughts on the tools...
Read more
Learn how CSS Electronics has empowered more than 500 end users to visualize their CAN bus data using the Amazon Athena data source for Grafana.
Read more
In this post, we explore how the OpenTelemetry project has carried out its vision for vendor neutrality in the observability space.
Read more
With the Catchpoint data source for Grafana, you can create dynamic and interactive dashboards to visualize your Catchpoint performance monitoring...
Read more
Default to isolation in Grafana while maintaining the ability to add optional sharing. Learn how to set up a streamlined system for managing user...
Read more
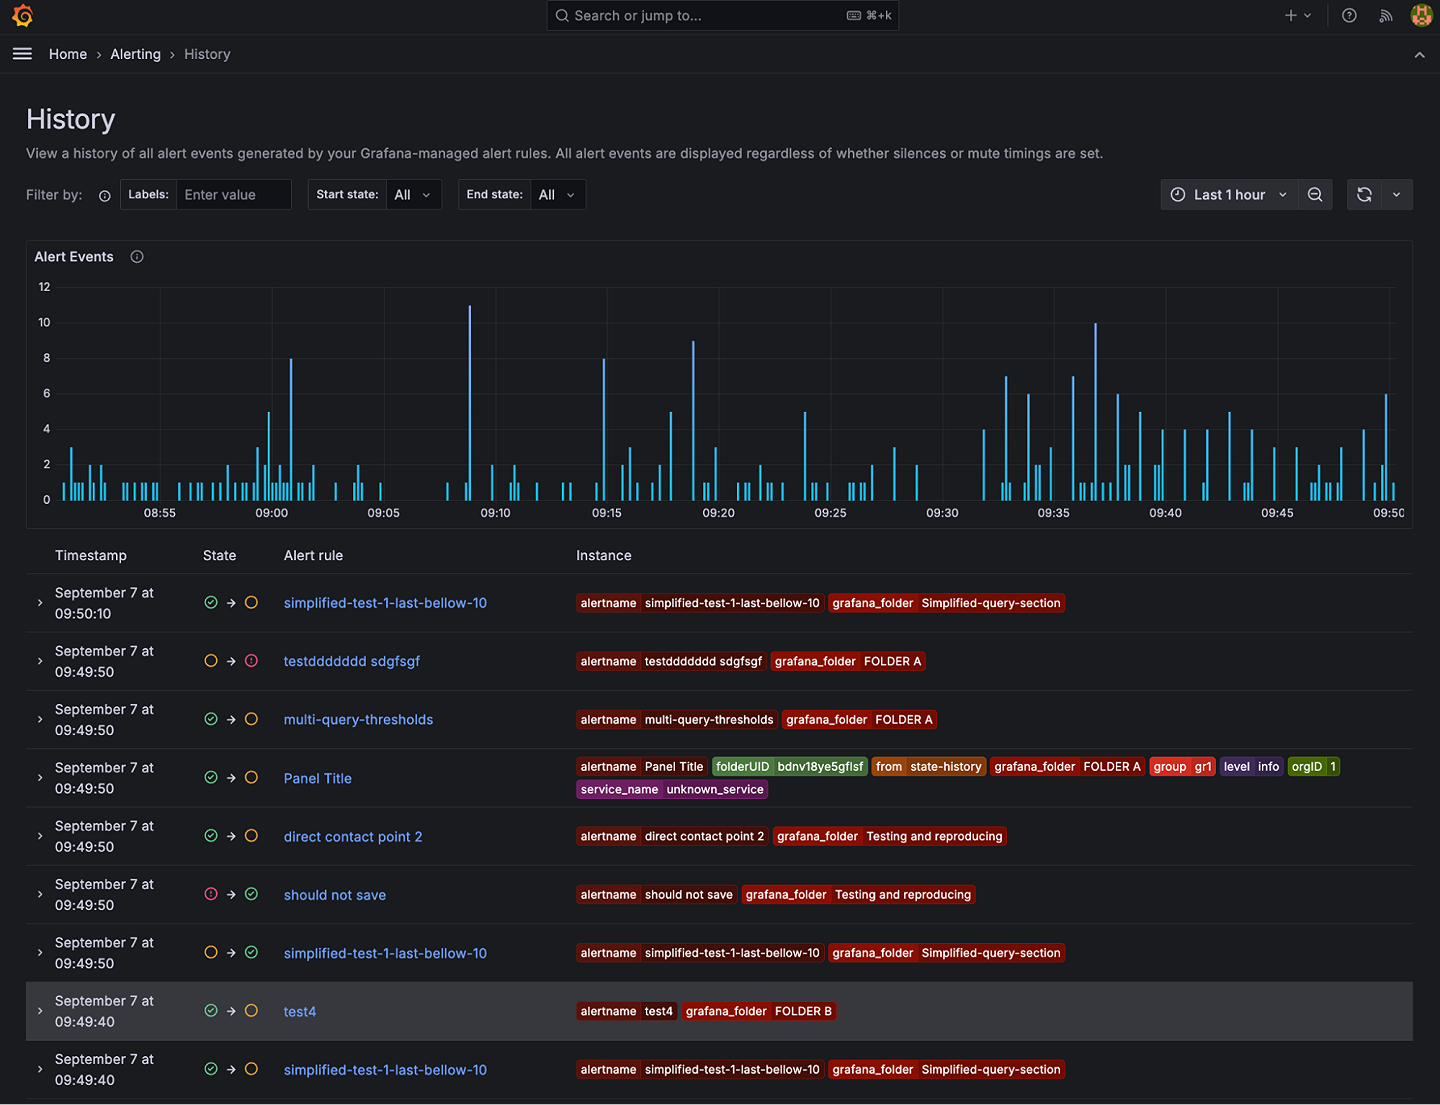
Get a clear, comprehensive view of alert state transitions over time to help identify patterns, diagnose issues quicker, and improve your overall...
Read more