

Measuring service response time and latency: How to perform a TCP check in Grafana Cloud Synthetic Monitoring
When your database stops accepting connections or your mail server becomes unreachable during business hours, the impact is immediate and costly. Fortunately, the right monitoring strategy can help you detect these TCP connection failures early on, and prevent them from impacting the user experience.
With Grafana Cloud Synthetic Monitoring — a solution that lets you proactively monitor the performance of your critical applications from locations around the world — TCP checks can be your first line of defense against service failures and network connectivity issues. With TCP checks, you can test connections on specific ports, simulate real user interactions, and measure the availability and performance of your services.
You might use TCP checks when you're:
- Monitoring database connections and availability
- Verifying mail server accessibility and performance
- Ensuring FTP servers are accepting file transfers
- Checking message queue connectivity and response times
In this blog post, we'll walk through how TCP checks work and show you how to set one up in Grafana Cloud Synthetic Monitoring. You can also follow along with our step-by-step video tutorial below.

What are TCP checks?
Grafana Cloud Synthetic Monitoring enables you to proactively monitor the performance of your applications and services from public and private probes located around the world. It allows you to set up a variety of checks, including ping checks, browser checks, scripted checks, DNS checks, and TCP checks.
TCP checks connect to endpoints on specified hostnames, IP addresses, and ports to verify that the servers accept a connection. Unlike HTTP checks, which focus on web services, TCP checks work at the transport layer, making them ideal for monitoring any service that communicates over TCP. The key benefits of TCP checks include:
- Real-time monitoring to quickly diagnose network connectivity issues
- Security monitoring to detect unusual port behavior
- Global TCP validation, which provides valuable insights into connection success rates, response times, and service availability from locations around the world
Setting up your first TCP check
Run a TCP check
Let’s walk through setting up a TCP check. This process involves a few key configuration steps.
1. Create a Grafana Cloud account
If you don’t already have one, sign up for a free Grafana Cloud account.
2. Navigate to Synthetic Monitoring
In the Grafana Cloud UI, go to Testing & synthetics to access tools for performance testing and optimization.


5. Set a timeout
With our TCP check added, select Add query/response button. The query will be “^220 ([^ ]+) ESMTP (.+)$” and the response will be “EHLO prober\r”.
We’ll also specify the maximum execution time for this check. If the check takes longer than this period to run, the check will be marked as failed. For this example, we’ll choose 10 seconds.

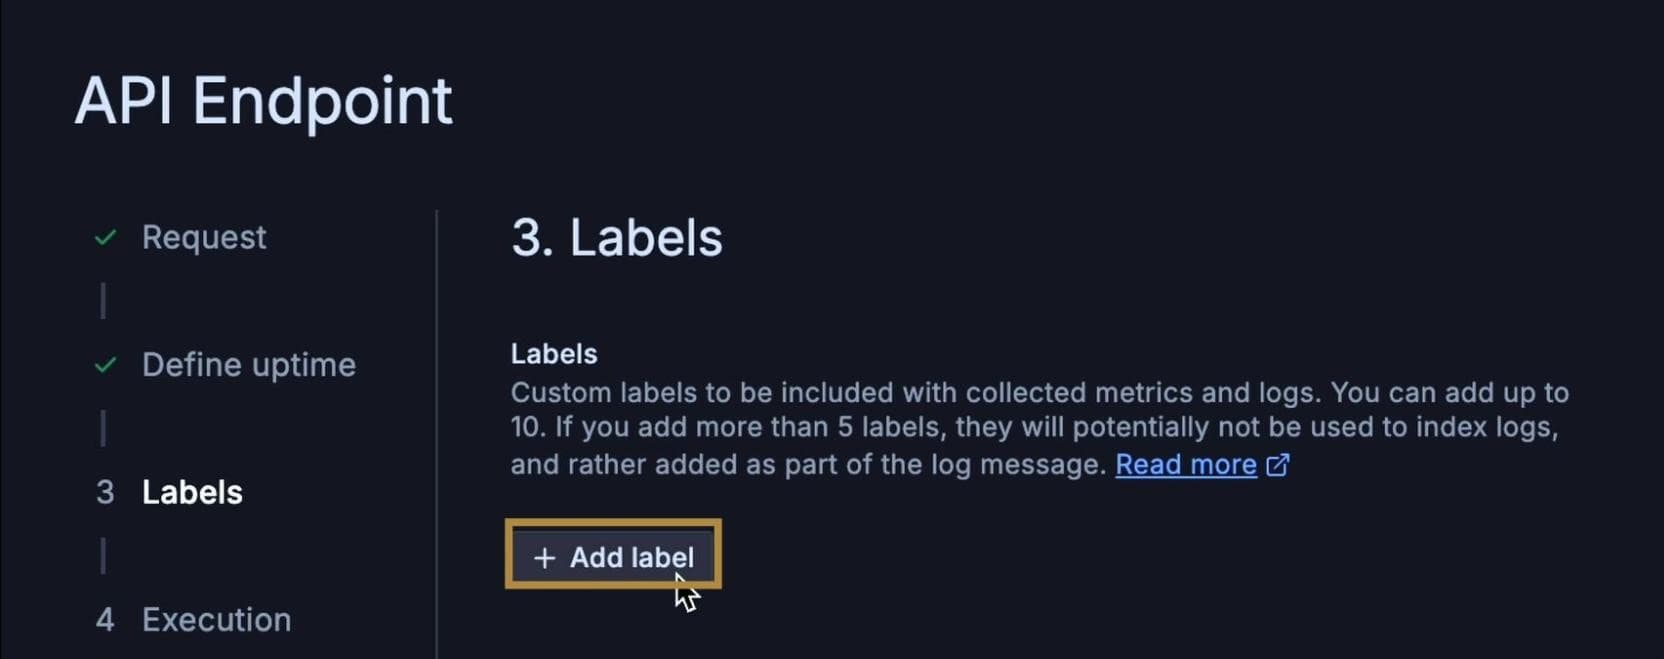
6. Add labels
Labels help you organize and filter your checks. Adding a label makes it easier to segment results by environment or use case in the future. For this example, we’ll use the label env:test.
7. Choose a probe location
Grafana Cloud offers access to over 20 globally distributed probe locations. For this example, we’ll select Calgary, Canada and Stockholm, Sweden. We advise that you choose the location closest to your users or infrastructure to best reflect their experience.


9. Create an alert
Alerting is an essential part of synthetic monitoring. When metrics deviate from expected performance, alerts are the most effective way to trigger necessary actions based on those metrics. For this example, we’ll use per-check alerts and choose 2 of 10 executions that fail in the last five minutes as the threshold to get alerted.

10. Save and run the check
Click Save to initiate the TCP check. Grafana Cloud will begin executing based on your configuration. You can also click the Test button to validate the check before saving.
Visualizing the check results
After letting our TCP check run for a few hours, it’s time to review the results. Grafana Cloud Synthetic Monitoring provides a preconfigured dashboard for each check, providing key insights to evaluate performance. On this dashboard, you’ll find important metrics like uptime, reachability, average latency, SSL Chain Expiry, and frequency.

As you scroll through the dashboard, you’ll find additional charts that offer deeper visibility, including response latency by probe location. All data and visualizations are updated in real time as the test continues to run, allowing for continuous performance monitoring and faster issue detection.
Wrapping up
TCP checks can provide additional visibility into the connectivity and performance of your non-HTTP services. By leveraging Grafana Cloud Synthetic Monitoring, you can effortlessly implement and manage TCP checks to ensure the reliability of your most critical backend services.
To learn more about Synthetic Monitoring in Grafana Cloud, please refer to our technical docs. You can also explore this dashboard on Grafana Play, which features example checks.
To go beyond TCP checks and understand how real users experience your application, explore Grafana Cloud Frontend Observability, a real user monitoring service that delivers real-time, actionable insights into performance, errors, and user journeys. To learn more, refer to the technical documentation.
Grafana Cloud is the easiest way to get started with synthetic monitoring. We have a generous free tier that includes 100k test executions per month and more. Sign up for free now!

