AWS metric ingestion for less: Save money and get near real-time stream into Grafana Cloud
There's a new way to ingest AWS metrics into Grafana Cloud that makes observing your AWS resources more cost-effective, easier to operate, and more accurate.
You can now stream metrics into the AWS Observability app in Grafana Cloud in near real-time thanks to our new integration with Amazon CloudWatch and Amazon Data Firehose. We're already using it internally, and we're finding that it's not only easier to operate—it's at least 10 times more cost-effective.
In this blog post, we'll explain how this new integration works and how you can start putting it to use today.

Push—not pull—for peace of mind
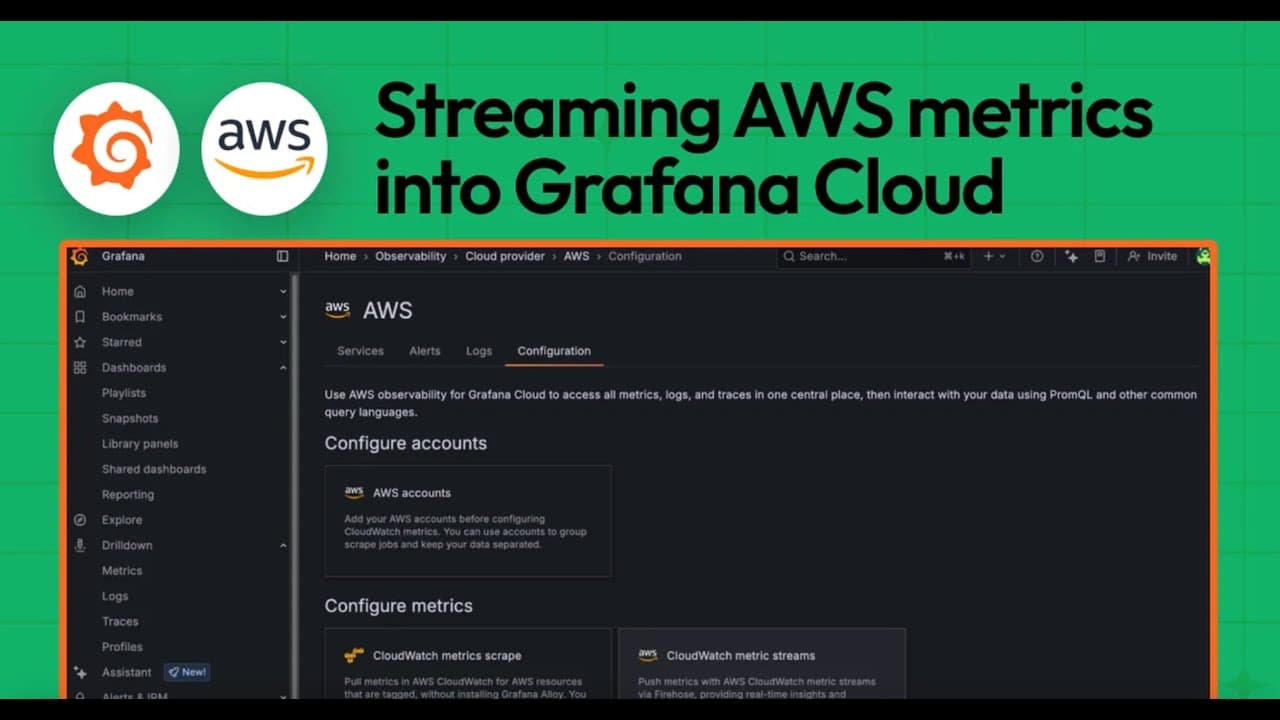
Our solution is based on CloudWatch Metric Streams, which pipes metrics through a Data Firehose delivery stream to our custom HTTP endpoint. For most use cases, this is an upgrade from our other collection method in the AWS Observability app, which pulls metrics from AWS intervals.
The advantage of this design is that it only requires resource definitions in AWS and credentials from Grafana Cloud. And since everything is managed infrastructure, the operational burden is minimal compared to running your own Grafana Alloy instance.

The diagram above illustrates how the process works:
- AWS CloudWatch streams metrics to Data Firehose
- Metric events are backed up on S3 in case of a write failure.
- Metrics are forwarded to Grafana Cloud’s Data Firehose receiver endpoint and translated for Grafana Cloud Metrics.
- Users can then query and alert on AWS metrics.
At least 10 times more cost-effective
We’ve been using CloudWatch Metric Streams internally to observe our own AWS resources, and we've found it to be at least 10 times as cost-effective as the old scrape jobs. This is due to Amazon Data Firehose operations costing less than Amazon CloudWatch API calls.
We are using the same Terraform scripts as described in our configuration guide.
The scripts:
- Create an access policy and authentication token in Grafana Cloud
- Create an Amazon CloudWatch metric stream and Data Firehose resources pointing to our new endpoint.
The only manual step is to verify that your metrics actually arrive.
Metrics in near real-time
The pull-style scrape jobs query CloudWatch for new metrics every five minutes, by default. This delay can impact alerts that are fired with the same delay. By using the new push-based approach we avoid this lag.
We process metrics as they arrive and alert in time. Furthermore, the metrics are more granular due to a higher data points per minute (DPM) number.
Enriching your streamed metrics with resource metadata
So far we’ve omitted another new component offered as part of our integration with CloudWatch Metric Streams: AWS resource metadata scrape jobs.
AWS resource metadata scrape jobs are configured and run in Grafana Cloud, and they generate info metrics containing metadata as labels for your AWS resources. These labels can then be used to enrich your streamed AWS metrics at ingestion time with the associated resource’s ARN and tags.
Follow our configuration guide to set up one AWS resource metadata scrape job for each AWS account you’re streaming metrics from for all the regions that you need. We recommend configuring the scrape job with the same set of AWS namespaces that you configured your metric stream to push metrics for. That way you can get the most out of your streamed metrics.
Migrating and when to stick with scape jobs
Some Amazon CloudWatch metrics have a very low DPM rate. For instance, we only see one S3 update once per day, which might be difficult to handle for some queries. In these cases we advise you to stick with the old scrape job setup. The good news is that the old pull-based and the new push-based approaches can work hand-in-hand alongside each other. One set of metrics can be pushed while the other set is still being pulled.
This leads us to the migration strategy. If you are already importing metrics via CloudWatch scrape jobs, you can enable push-based metrics for selected namespace. There is no need to migrate all AWS namespaces at once. The dashboards and alerts will continue to work across your different metric sources.
What’s next
With this latest update, we’ve reached feature parity with the CloudWatch scrape jobs, but we are already planning beyond that. In the future, we plan to offer ways to configure your metrics ingest experience. One such feature will be the ability to select which tags from resource metadata get attached to the streamed metrics. Another feature will be the ability to apply Prometheus relabel rules to labels on your streamed metrics.
In the meantime, check out some of the other improvements we've made since launching the AWS Observability app last year, including support for streaming logs and the ability to manage the app as code. We've also expanded our observability solutions to Google Cloud and Microsoft Azure, giving you one hub to monitor all your cloud provider resources.
Grafana Cloud is the easiest way to get started with metrics, logs, traces, dashboards, and more. We have a generous forever-free tier and plans for every use case. Sign up for free now!


