How to monitor your homelab with Beyla, eBPF, and OpenTelemetry
Goutham Veeramachaneni sees his homelab as a proving ground.
As a longtime engineer and product manager here at Grafana Labs, he built the homelab so he could deploy the same tools used in production, face the same observability challenges, and ultimately make monitoring more accessible. But he quickly discovered that the world of self-hosted services is messy, thanks to fragmented metrics, diverse stacks, and inconsistent monitoring.
“For traditional hobbyist use cases, most of the applications have no metrics at all,” Veeramachaneni said. “Even if they do have metrics, there is no consistency between applications. … I need to have a set of alerts and dashboards for each different application, and this is just too hard to manage.”
Even his own projects—a homegrown book tracker and a private microblog—demanded extensive, error-prone manual work if he wanted to instrument them with OpenTelemetry. That’s where Grafana Beyla came in.
Beyla, the open source eBPF-based, zero-code instrumentation tool, provides application and network observability for any Linux application. And it’s simple to deploy, whether in a homelab or in a production Kubernetes cluster.
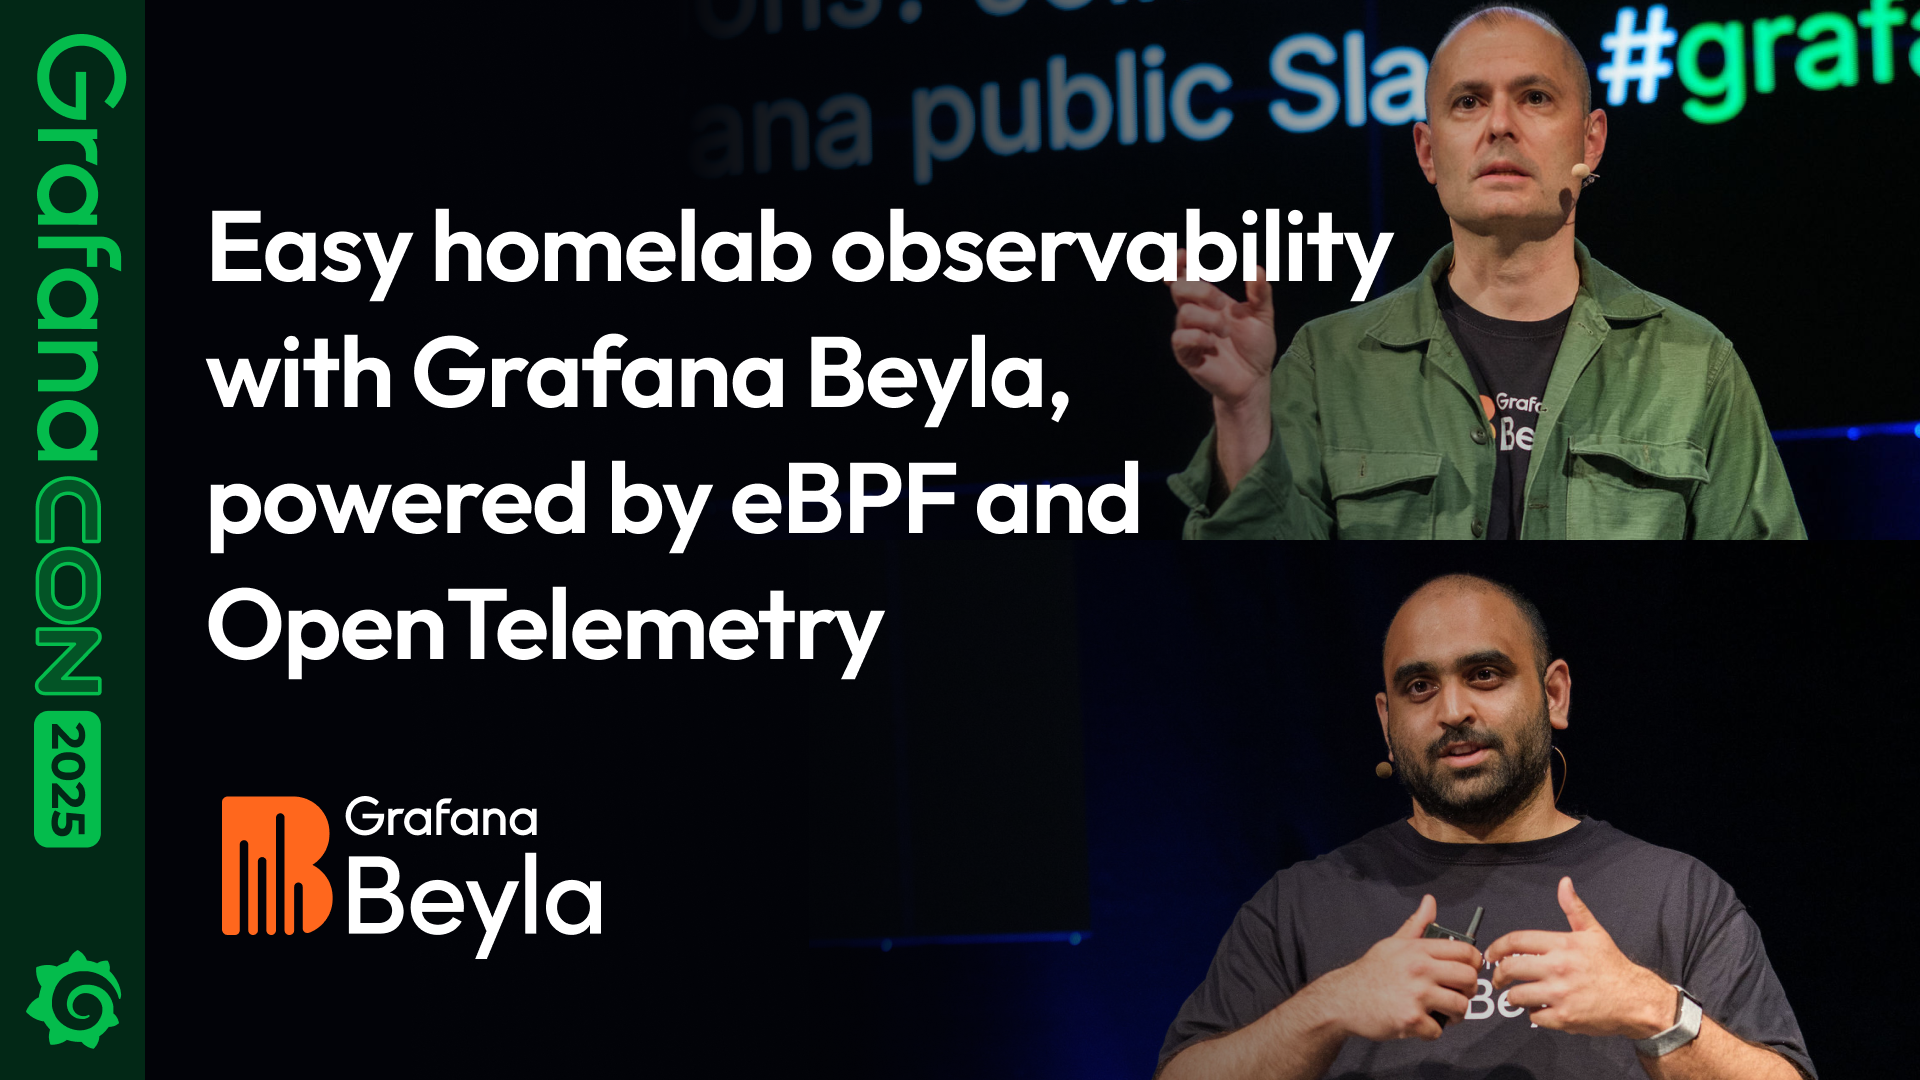
Veeramachaneni and Nikola Grcevski, a principal software engineer at Grafana Labs, shared how Beyla, eBPF, and OpenTelemetry combine to make homelab observability easy during their recent GrafanaCON 2025 session.
Note: The same week Veeramachaneni and Grcevski gave their talk, Grafana Labs announced the initial code drop of Beyla to OpenTelemetry, following through on a proposal to donate Beyla to the OpenTelemetry project under the new project name OpenTelemetry eBPF Instrumentation. Beyla will continue to exist as Grafana Labs’ distribution of the upstream OpenTelemetry eBPF Instrumentation.
Why Beyla and eBPF?
Grcevski, a Beyla maintainer, set out to address the persistent gaps in observability tooling: instrumenting legacy, third-party, or simply neglected services where code modification and traditional agents aren’t practical.
eBPF proved to be a key component. Because it allows small, safe programs to run inside the Linux kernel without risking crashes or instability, Beyla could use it to observe application and network activity directly at the kernel level. That enabled Beyla to collect powerful observability data from any application, overcoming the limitations of traditional instrumentation tools. And it supported Beyla in creating a new class of auto-instrumentation that doesn’t care about frameworks or binaries.
“With this technology, we can tap into any aspect of this application stack, and we can extract signals, which we then turn into telemetry,” Grcevski said. “We send them to an OpenTelemetry format, or we can export them directly to Prometheus. This is how this magic happens.”
Simple deployment, consistent monitoring
For Veeramachaneni’s homelab, Beyla was transformative. With it running as a DaemonSet across his Kubernetes nodes, he was able to collect consistent, OpenTelemetry-compliant rate, error, and duration (RED) metrics and distributed traces—even from uninstrumented, off-the-shelf applications. Beyla’s ability to extract telemetry from HTTP and Redis protocols was especially valuable, because so many modern applications use them.
This approach also allowed Beyla to capture this telemetry in a runtime-agnostic manner, collecting important metadata such as Kubernetes labels and zone information for automatic correlation and troubleshooting.
“You get full distributed tracing,” Veeramachaneni said. “All of this is coming from Beyla, which I think is really cool.”

Deploying Beyla is mostly straightforward and painless, he said. It requires running a simple Helm install that provides all the necessary functionality out of the box, across multiple languages. (There can be exceptions on specific hardware; Raspberry Pi devices need to recompile the Linux kernel before deployment, for example.)
How Beyla compares to native instrumentation
Although Beyla enables rapid, broad-spectrum telemetry, there are nuances and trade-offs involved. While Beyla can see and correlate protocol-level traffic with almost no code changes, it doesn’t offer the same context-rich telemetry as native, source-level instrumentation.
Additionally, native instrumentation supports extending traces with extra business context, and it provides full details about templated SQL queries. Beyla, however, intentionally avoids exposing full SQL queries and other potentially sensitive data for security reasons.
Beyla also requires some protocol- and language-specific adjustments; it automatically handles corner cases for some languages—think of Go’s goroutines or the async event loops in Node.js—but other platforms may require minor tweaks. For these reasons, it’s best to think of Beyla as a “fast start” on the journey to full instrumentation, Veeramachaneni said.
“It took me several hours to manually instrument a very simple Go application,” he said. “And if you suddenly have 20 applications, you tell your engineers, ‘Now you have to go manually instrument everything,’ they’re just going to go on holiday together. So what Beyla gives you is, within one command, you get 80% of the way. And then you can use your engineering bandwidth to say, ‘Actually, these two applications are the most important. Let’s manually instrument them correctly.’”
Observability for everyone
The same observability fundamentals apply everywhere, from a handful of self-hosted services in a homelab to thousands of orchestrated containers in production. But installing, configuring and maintaining instrumentation across so many languages—or even binaries without source code—has always been daunting.
By blending the kernel-powered reach of eBPF with the standards of OpenTelemetry, Beyla eliminates that barrier, making consistent, powerful insights available to everyone. For Veeramachaneni and Grcevski, that’s the future of observability.
“We built it for the community,” Grcevski said. “We built it for everybody to try this.”
Grafana Cloud is the easiest way to get started with metrics, logs, traces, dashboards, and more. We have a generous forever-free tier and plans for every use case. Sign up for free now!