
Integrating Deno and Grafana Cloud: How to observe your JavaScript project with zero added code
Andy Jiang is a JavaScript engineer with nearly 10 years of experience. He’s interested in making JavaScript and TypeScript simpler to use. He currently works at Deno as a product marketing manager. Outside of work, Andy likes cooking, writing, and playing tennis.
Observability is essential for modern applications. Metrics, logs, and traces allow you to troubleshoot production issues, monitor performance, and understand usage patterns. But in practice, adding observability to your JavaScript server — whether its Node.js or Deno — means dealing with SDKs, manually instrumenting code, or deploying third-party agents.
What if you could skip all of that?
In this post, we’ll explore how you can with Deno and Grafana Cloud. We’ll walk through how to set up Deno alongside Grafana Cloud, as well as how to filter logs by request, set up tracing for distributed systems, and get built-in metrics to observe your JavaScript projects. Note: you can find the code from this blog in this GitHub repo.
Observability without instrumentation
Deno, a spiritual successor to Node, is a modern, open source, and zero-config toolchain for JavaScript and TypeScript. Deno natively supports TypeScript and web standard APIs, and comes with a formatter, linter, test runner, and more, so you can skip pulling together your tools and dive right into coding!
Deno also includes built-in OpenTelemetry support for monitoring metrics, logs, and traces. In fact, Deno automatically implements observability into APIs like console.log, Deno.serve, node:http, and fetch, so you can get immediate telemetry data without any additional work. You can also run Node.js backends using Deno, automatically enabling observability for your Node projects.
You can install Deno with the following command:
curl -fsSL https://deno.land/install.sh | shTo confirm that Deno has installed properly, you can run:
deno -v
deno 2.4.3
Great! Now that we have Deno installed, let’s take a quick detour and set up a collector service to route all telemetry data to Grafana Cloud.
Set up Grafana Cloud
We'll use a Docker container to run the OpenTelemetry collector, which is responsible for receiving telemetry data. In a Dockerfile, we'll pull from otel/opentelemetry-collector-contrib:latest, copy the necessary config files into the container, and set the default command that will run when the container starts:
FROM otel/opentelemetry-collector-contrib:latest

COPY otel-collector.yml /otel-config.yml

CMD ["--config", "/otel-config.yml"]
Next, create a free Grafana Cloud account, which will provide you with a Grafana Cloud stack. Click Details, find OpenTelemetry, and then click Configure. This page will provide you with the OTLP Endpoint, Instance ID, and Password / API token, which you'll need to configure your collector.
 Finally, in our
 otel-collector.yml file, let’s define how telemetry data should be exported to Grafana Cloud with those aforementioned details:
receivers:
  otlp:
    protocols:
      grpc:
        endpoint: 0.0.0.0:4317
      http:
        endpoint: 0.0.0.0:4318

exporters:
  otlphttp/grafana_cloud:
    endpoint: $_YOUR_GRAFANA_OTLP_ENDPOINT
    auth:
      authenticator: basicauth/grafana_cloud

extensions:
  basicauth/grafana_cloud:
    client_auth:
      username: $_YOUR_INSTANCE_ID
      password: $_YOUR_API_TOKEN

processors:
  batch:

service:
  extensions: [basicauth/grafana_cloud]
  pipelines:
    traces:
      receivers: [otlp]
      processors: [batch]
      exporters: [otlphttp/grafana_cloud]
    metrics:
      receivers: [otlp]
      processors: [batch]
      exporters: [otlphttp/grafana_cloud]
    logs:
      receivers: [otlp]
      processors: [batch]
      exporters: [otlphttp/grafana_cloud]
Note that you will have to fill in your own information for $_YOUR_GRAFANA_OTLP_ENDPOINT, $_YOUR_INSTANCE_ID, and $_YOUR_API_TOKEN.
You can now build and run your collector Docker instance to start collecting your telemetry data:
docker build -t otel-collector . && docker run -p 4317:4317 -p 4318:4318 otel-collectorFor more information on how to set up Grafana Cloud with Deno, please refer to our documentation.
Filter logs by request
Let's use this sample project: a simple Express API server.
Many engineers reach for console.log as the simplest way to debug. But on their own, these logs can be noisy. For instance, can we tell from the following logs whether book 1 or book 2 has a null name field?
[http] GET /api/book/1
[http] GET /api/book/2
[db] SELECT * FROM books WHERE id = 1
[db] SELECT * FROM books WHERE id = 2
error: Uncaught (in promise) PostgresError: 'name' column is null
  throw new PostgresError(`'name' column is null`);

    at query (file:///tmp/main.ts:29:9)
    at queryBook (file:///tmp/main.ts:25:3)
    at handleRequest (file:///tmp/main.ts:21:3)
    at file:///tmp/main.ts:18:1
It’s difficult without context, since these logs are from two parallel interwoven requests.
However, if we associate each log with its respective request, then we can find the answer:
[req:1] [http] GET /api/book/1
[req:2] [http] GET /api/book/2
[req:1] [db] SELECT * FROM books WHERE id = 1
[req:2] [db] SELECT * FROM books WHERE id = 2
[req:1] error: Uncaught (in promise) PostgresError: 'name' column is null
  throw new PostgresError(`'name' column is null`);

    at query (file:///tmp/main.ts:29:9)
    at queryBook (file:///tmp/main.ts:25:3)
    at handleRequest (file:///tmp/main.ts:21:3)
    at file:///tmp/main.ts:18:1
Turns out, the one missing its name is book 1!
But adjusting your logs to include a unique request ID can be tricky to maintain and scale:
 app.get("/api/book/:id", async (req, res) => {
+  const requestId = Math.random();
+  console.log(`[req:${requestId}] [http] GET /api/book/${req.params.id}`);
-  console.log(`[http] GET /api/book/${req.params.id}`);
   const id = req.params.id;
   const book = await getBookFromDatabase(requestId, id);
   res.send(book);
 });

+ async function getBookFromDatabase(requestId: number, bookId: string) {
+   console.log(`[req:${requestId}] [db] getBookFromDatabase ${bookId}`);
-   console.log(`[db] getBookFromDatabase ${bookId}`);
    const book = books.get(bookId);
    if (book === undefined) throw new Error("No book found.");
    if (!book.author) throw new Error("Book is missing author.");
    return book;
  },
Deno’s built-in OpenTelemetry support will automatically associate console.log with the request that calls it. Just start the server using Deno with OTEL_DENO=true:
OTEL_DENO=true deno -NRE server.jsConnecting spans and traces by request
Spans and traces help answer the who, what, when, and duration of exceptions in production. Without any additional code instrumentation, Deno will automatically create a span for each incoming and outgoing HTTP request (this includes fetch, Deno.serve, and node:http):
 This trace shows a single GET request, which triggered an authorization check, and two database queries.
In order to have the subsequent spans nested correctly under their parent operation in the trace, we can add some additional code that assigns each operation a span ID and passes that value as a Parent Span ID for its children operations.
To make that simpler, here's a utility function withSpan that wraps the OpenTelemetry API function startActiveSpan and handles the span lifecycle that includes setting the status code and recording exceptions:
import { Span, SpanStatusCode, trace } from "@opentelemetry/api";

const tracer = trace.getTracer("api");

export function withSpan<Args extends unknown[], T>(
  name: string,
  cb: (span: Span, ...args: Args) => Promise<T>,
): (...args: Args) => Promise<T> {
  return (...args: Args) => {
    return tracer.startActiveSpan(name, async (span) => {
      try {
        return await cb(span, ...args);
      } catch (err) {
        span.setStatus({ code: SpanStatusCode.ERROR, message: String(err) });
        span.recordException(err as Error);
        throw err;
      } finally {
        span.end();
      }
    });
  };
}
This utility function can now wrap our getBookFromDatabase function to provide it with the proper span context:
import { withSpan } from "./utils.ts";

export const getBookFromDatabase = withSpan(
  "getBookFromDatabase",
  async function getBookFromDatabase(span, bookId: string) {
    span.setAttribute("book_id", bookId);
    console.log(`[db] getBookFromDatabase ${bookId}`);
    await new Promise((resolve) => setTimeout(resolve, 300));
    const book = books.get(bookId);
    if (book === undefined) throw new Error("No book found.");
    if (!book.author) throw new Error("Book is missing author.");
    return book;
  },
);
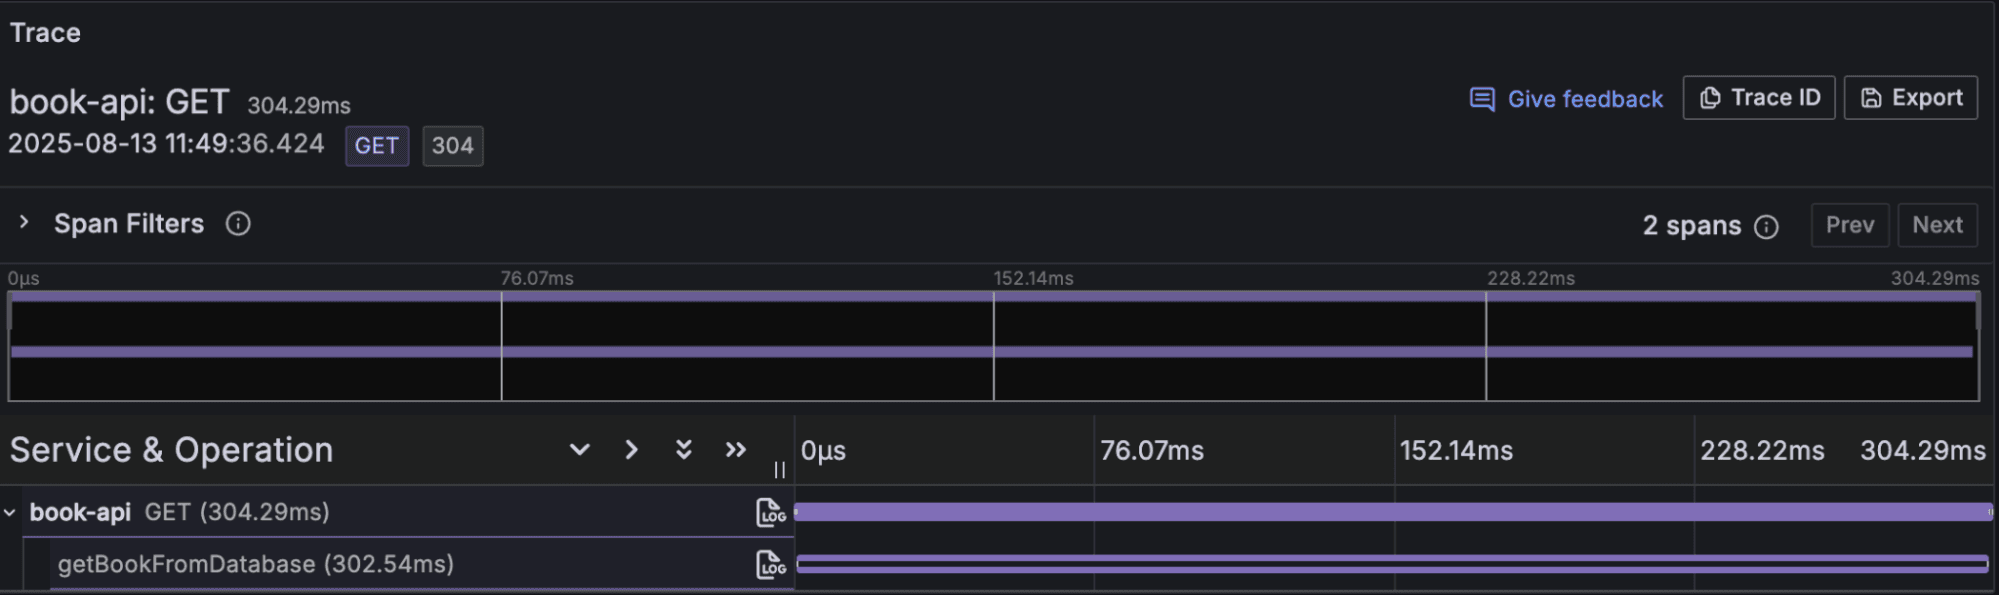
Now when we send another request to our API and view its trace, we can see the new getBookFromDatabase as a nested span under the parent HTTP trace:
Distributed tracing made easy
But what if a single request has to go through several microservices or edge functions? Tracing in a distributed system is possible, too, but requires propagating the “parent operation” context (the operation that triggers the entire set of operations) from one service to another when making a request.
You could implement this logic yourself, where you manually inject the header into the request. Here’s an example of a “trace-aware” fetch:
import { trace } from "npm:@opentelemetry/api";

export function fetchWithTrace(req: Request): Promise<Response> {
  const span = trace.getActiveSpan();
  if (!span) return fetch(req);
  const spanContext = span.spanContext();
  const traceparent = `00-${spanContext.traceId}-${spanContext.spanId}-01`;
  req.headers.set("traceparent", traceparent);
  return fetch(req);
}

// every call to `fetch` now needs to be replaced with `fetchWithTrace`
const resp = await fetchWithTrace(new Request("<https://example.com>"));
But that’s not all — on the receiving end, you’ll also need to read back the traceparent header and create a new span with it. Overall, this is tedious, error prone, and difficult to maintain.
Using Deno and its built-in OTel support skips all of this. Deno automatically propagates trace information between services: injecting trace information into outbound requests and reading trace information from incoming requests.
Let’s take a look at an example. We’ll run a new script that simply calls the API server with fetch:
const resp = await fetch("<https://localhost:8000/api/book/1>");
const book = await resp.json();
console.log(book);
We’ll run this with Deno and OTel:
$ deno run -A --unstable-otel main.ts
{ id: "1", title: "The Great Gatsby", author: "F. Scott Fitzgerald" }
In Grafana Cloud, we can see that the latest trace has a new service name:
 Clicking on that reveals three spans:
 Deno has automatically tracked a single trace across two services. For more complex microservice architectures, you could imagine having deep nests of spans across several services.
Built-in metrics
Metrics are a great way to alert you when to investigate an issue. They are aggregate data that show how frequently something is happening. For example, a common setup for any web server would be to measure the percentage of requests with 500 status codes, and to set an alert when that percentage exceeds 1%.
 If you want more context about the health of your program, Deno will also automatically collect metrics on V8, letting you monitor metrics such as
 v8js_memory_heap_size_bytes and garbage collection duration.
What’s next
The telemetry Deno provides out of the box is a powerful foundation. With zero effort, your services become visible in metrics, logs, and traces, and they’re all unified and searchable within Grafana Cloud. From here, you can extend your observability with custom spans, events, or domain-specific metrics.
For more information, you can refer to Deno's OpenTelemetry documentation, this step-by-step tutorial for setting up Deno and Grafana, as well as the Grafana Cloud documentation.

