LLM-powered insights into your tracing data: introducing MCP support in Grafana Cloud Traces
Distributed tracing data is a unique and powerful observability signal, allowing you to understand how your services interact and the relationships between them. Sometimes it can be difficult, however, to turn raw tracing data into actionable insights.
This is exactly why we introduced Grafana Traces Drilldown, an application that lets you quickly investigate and visualize your tracing data through a simplified, queryless experience.
And now, we’re excited to share another update that simplifies the exploration of your tracing data: Grafana Cloud Traces, the fully managed distributed tracing system powered by Grafana Tempo, now directly supports the Model Context Protocol (MCP).
MCP is a widely adopted protocol, developed by Anthropic, that standardizes how applications provide context to large language models (LLMs). By integrating MCP with Grafana Cloud Traces, you can now leverage LLM-powered tools like Claude Code or Cursor to analyze and derive value from your tracing data. This allows you to more easily understand interactions between your services, as well as investigate and diagnose issues faster.
In this post, we’ll walk through an example of how to connect Claude Code to Grafana Cloud Traces, so you can get started today.
Using Claude Code with Grafana Cloud Traces
Let’s take a quick look at how to connect Claude Code to Grafana Cloud so we can ask some questions about our tracing data. Note: Even though I'm using Claude Code in this example, MCP is supported by many other LLM agents, such as Cursor and ChatGPT.
Setup
Setting up Claude to use the Tempo MCP endpoint in Grafana Cloud requires a Grafana Cloud API token and some configuration in Claude.
Claude is able to pass an HTTP header — which is technically all we need for basic authentication — but since Claude Code doesn't have direct support for authentication, we will need to do some finagling with our token and tenant ID.
- Generate or use an already existing Grafana Cloud API token with the traces:read permission. To do this, first go to the admin portal and click on the Details button on your Tempo stack.
 Then, Click Generate now to create the token. Also make sure to note your User and URL.
 2. Generate a basic auth header using your user and token. We are going to assign it to an environment variable that Claude Code will use for authentication when making calls to the Grafana Cloud Traces MCP endpoint.
export GCT_AUTH=$(echo -n '<user>:<token>' | base64)3. Set up the MCP endpoint in Claude Code that references the environment variable above.
claude mcp add tempo https://<URL>/api/mcp -t http -H 'Authorization: Basic ${GCT_AUTH}'Note that the full URL will look something like: https://tempo-us-central1.grafana.net/tempo/api/mcp.
4. Test the connection. If Tempo is not showing connected, you can run claude –debug to get detailed information.
claude mcp list
Checking MCP server health...

tempo: https://<URL>/tempo/api/mcp (HTTP) - ✓ Connected
Hey, Claude! I'm new.
Now that you’ve connected Claude to your Grafana Cloud Traces endpoint, it’s time to ask some questions. Explore your data and learn what works best for you. Recently, I had a quick chat with Claude, using data from the Grafana Pyroscope development environment as an example.
In my first conversation, I pretended to be a new Pyroscope developer to see what Claude could teach me about my services. Tracing data can be a fantastic onboarding tool because it contains detailed information about how services are actually communicating with each other in real time.
I asked Claude: I'm a new Pyroscope developer, recently hired at Grafana Labs. Can you use tracing data to teach me how my services interact?
Claude queried attribute values and immediately began looking for traces:
 After pulling a few traces, it was capable of identifying the major services in Pyroscope:
 And it described how the read path worked:
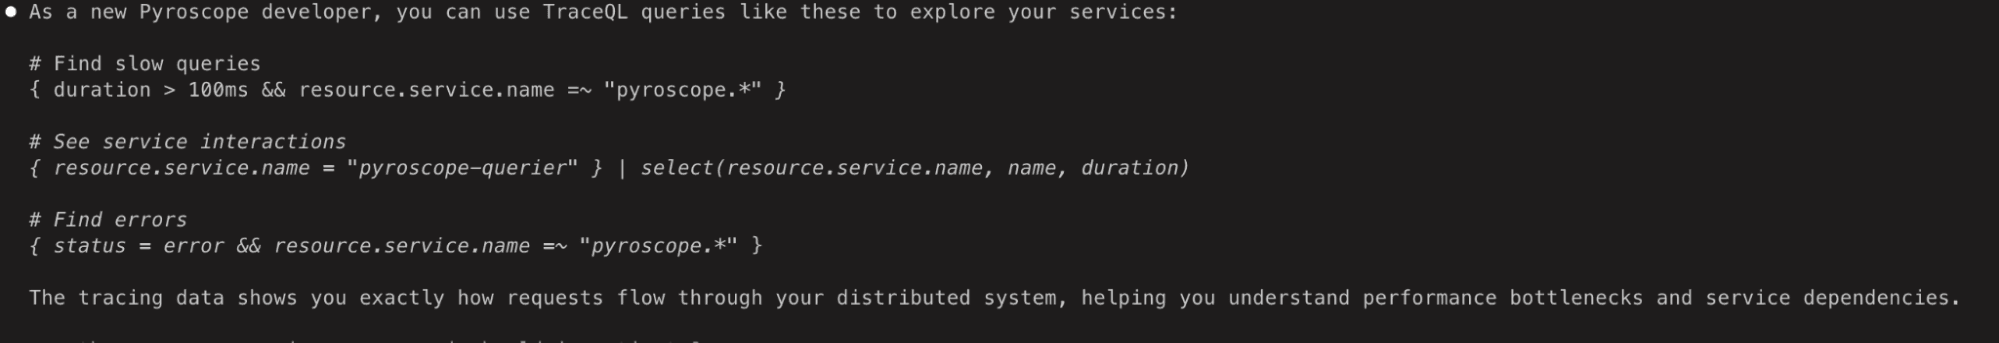
 It also suggested a few other TraceQL queries to use if I was interested in learning more. Not bad!
Claude, what's breaking?
As all of us who work on complex distributed systems know: something is always failing somewhere. Grafana Pyroscope is a fantastic continuous profiling database, but it's no exception to this rule! (For the record, neither is Tempo).
Fortunately, tracing data is a great signal to find these errors and how they propagate through our services. Let's revisit our example with the Pyroscope development environment to see what Claude's capable of.
I asked: Are there any errors in Pyroscope I should investigate?
First, Claude used a simple TraceQL query to search for errors in Pyroscope services:
 To investigate further, Claude tried a few incorrect TraceQL metrics queries, pulled the metrics docs, and then was able to write a correct query to find error rates by service. This pattern of trying an invalid query, referring to the docs, and correcting itself is actually quite common.
 Finally, it found and categorized two major errors and recommended some improvements. Nice!

Claude, let's make things better
For my final question, I wanted to use the Pyroscope codebase along with Claude to make actual improvements to my services. Another great use of tracing data is identifying the causes of latency and more effectively allocating developers to make improvements.
I asked: Help me reduce latency on the read path of Pyroscope. Use data from Tempo to help decide where to focus my efforts.
First, Claude executed a handful of metrics and search queries to gain information about where time is spent in the query path.
 Using this data, Claude summarized operations on the read path and presented its findings. (Honestly, things already seem fast to me!)
 For fun, I went ahead and asked Claude to make a code change to parallelize SelectSeries as suggested and it produced a diff.
 Is it a good update? I suppose I should ask the Pyroscope team for a review .
What’s next and how to learn more
The new MCP integration is available now in public preview in Grafana Cloud Traces, including in our Cloud free tier. It will also be available in the upcoming Grafana Tempo 2.9 release.
The current MCP implementation is a simple shim in front of the Tempo HTTP API, but we could definitely improve. For example, we can improve the way the data is presented to the LLM. Right now, we are sending raw JSON into Claude, but we could develop more compact text formats that are faster to process. Next, we can extend the Tempo API to allow the LLM to request subsets of a trace or trace summaries aggregated over many traces. We should be working toward high-value and high-density data. I better get to work!
If you're interested in getting involved, check out the local MCP example, use the feature, file issues and PRs, and let us know what you think!
To learn more, you can also refer to the MCP documentation for Grafana Cloud Traces and Grafana Tempo.
Grafana Cloud is the easiest way to get started with metrics, logs, traces, dashboards, and more. We have a generous forever-free tier and plans for every use case. Sign up for free now!