
Tracking planes with Grafana in real time: How to visualize the aircraft overhead with your own dashboard
Ever since I was little, I’ve been fascinated by airplanes. Whether it was the excitement of boarding a flight for a holiday or the wonder of admiring them from the ground, there’s always been something magical about these incredible machines.
Fast forward a few years, and now we have the ability to track aircraft in real-time from the palm of our hands using a variety of apps.
Living in Swansea (and soon Bristol) in the UK, I’m lucky enough to be under the flight paths of planes traveling to and from the U.S. and beyond. So it’s no surprise to anyone who knows me—friends, family, or my partner—that whenever I spot a plane overhead, I pull out a flight tracking app to find out where it’s headed.

As a Senior Solutions Architect on the Professional Services team at Grafana Labs, I spend my time helping people visualize all kinds of interesting data. So one evening I decided to use those skills to take on a personal project: building a Grafana dashboard that could show nearby aircraft in real time, powered by data from my ADS-B receiver and ingested into Grafana Cloud Logs. Let’s dive into how I did it.
ADS-B, and what it does
Automatic Dependent Surveillance–Broadcast (ADS-B) is a technology used by aircraft to broadcast their location, speed, altitude, and other flight data. These signals are transmitted over radio waves and can be picked up by anyone with the right equipment. That’s where software-defined radio (SDR) comes in. An SDR device lets you use software to process and decode radio signals, like those broadcast by planes.
That flight tracking apps I pull out to explore my curiosity? Sites like FlightAware and Flightradar24 are nearly entirely powered by individuals such as myself collecting the data and feeding it to the sites. This is something anyone with some basic hardware can do. In return for sending your data to them, you’ll get access to data shared by millions of your fellow flight-tracking enthusiasts.
What you need
To get you started on your flight-tracking journey, you’ll need the following bits and pieces:
- Raspberry Pi. I have a Model 3, but 4 or 5 is absolutely fine. You can also use a similar single board computer.
- SDR USB stick. There are many to choose from. I have the FlightAware Pro Stick.
- Antenna. You’d need an SDR Antenna that can support the 1090MHz frequency to receive ADS-B data. I have a Nooelec Indoor Aerial similar to this.
- adsb.im feeder image. This is what you run on your Raspberry Pi.
- adsb2loki. This is a container/Go binary responsible for grabbing data from the Pi and sending it to Grafana.
- Grafana Cloud account. Our Free Tier works nicely! You can also ship the data directly to Grafana Loki if you’re running open source.
Note: There are many communities out there dedicated to ADSB flight tracking and other pieces of equipment that can be used to further extend your reach. That’s far beyond the scope of a getting started guide, but there are many forums and Discord channels out there which can help you learn more about the different pieces of equipment. This is very much a guide for those starting the journey of aircraft tracking.

The adsb.im image on my Raspberry Pi provides a lot of cool features, such as being able to “feed” data to many different flight tracking providers. Conveniently, it also exposes a JSON endpoint that provides all nearby aircraft, which is the basis of this entire project. That gave me the perfect entry point to build a small Go script (aptly named adsb2loki) that retrieves this data every five seconds and ships it to Grafana Cloud Logs.

The result? Every five seconds, fresh aircraft positioning data is streamed into Grafana Cloud, ready to be queried, visualized, and explored.
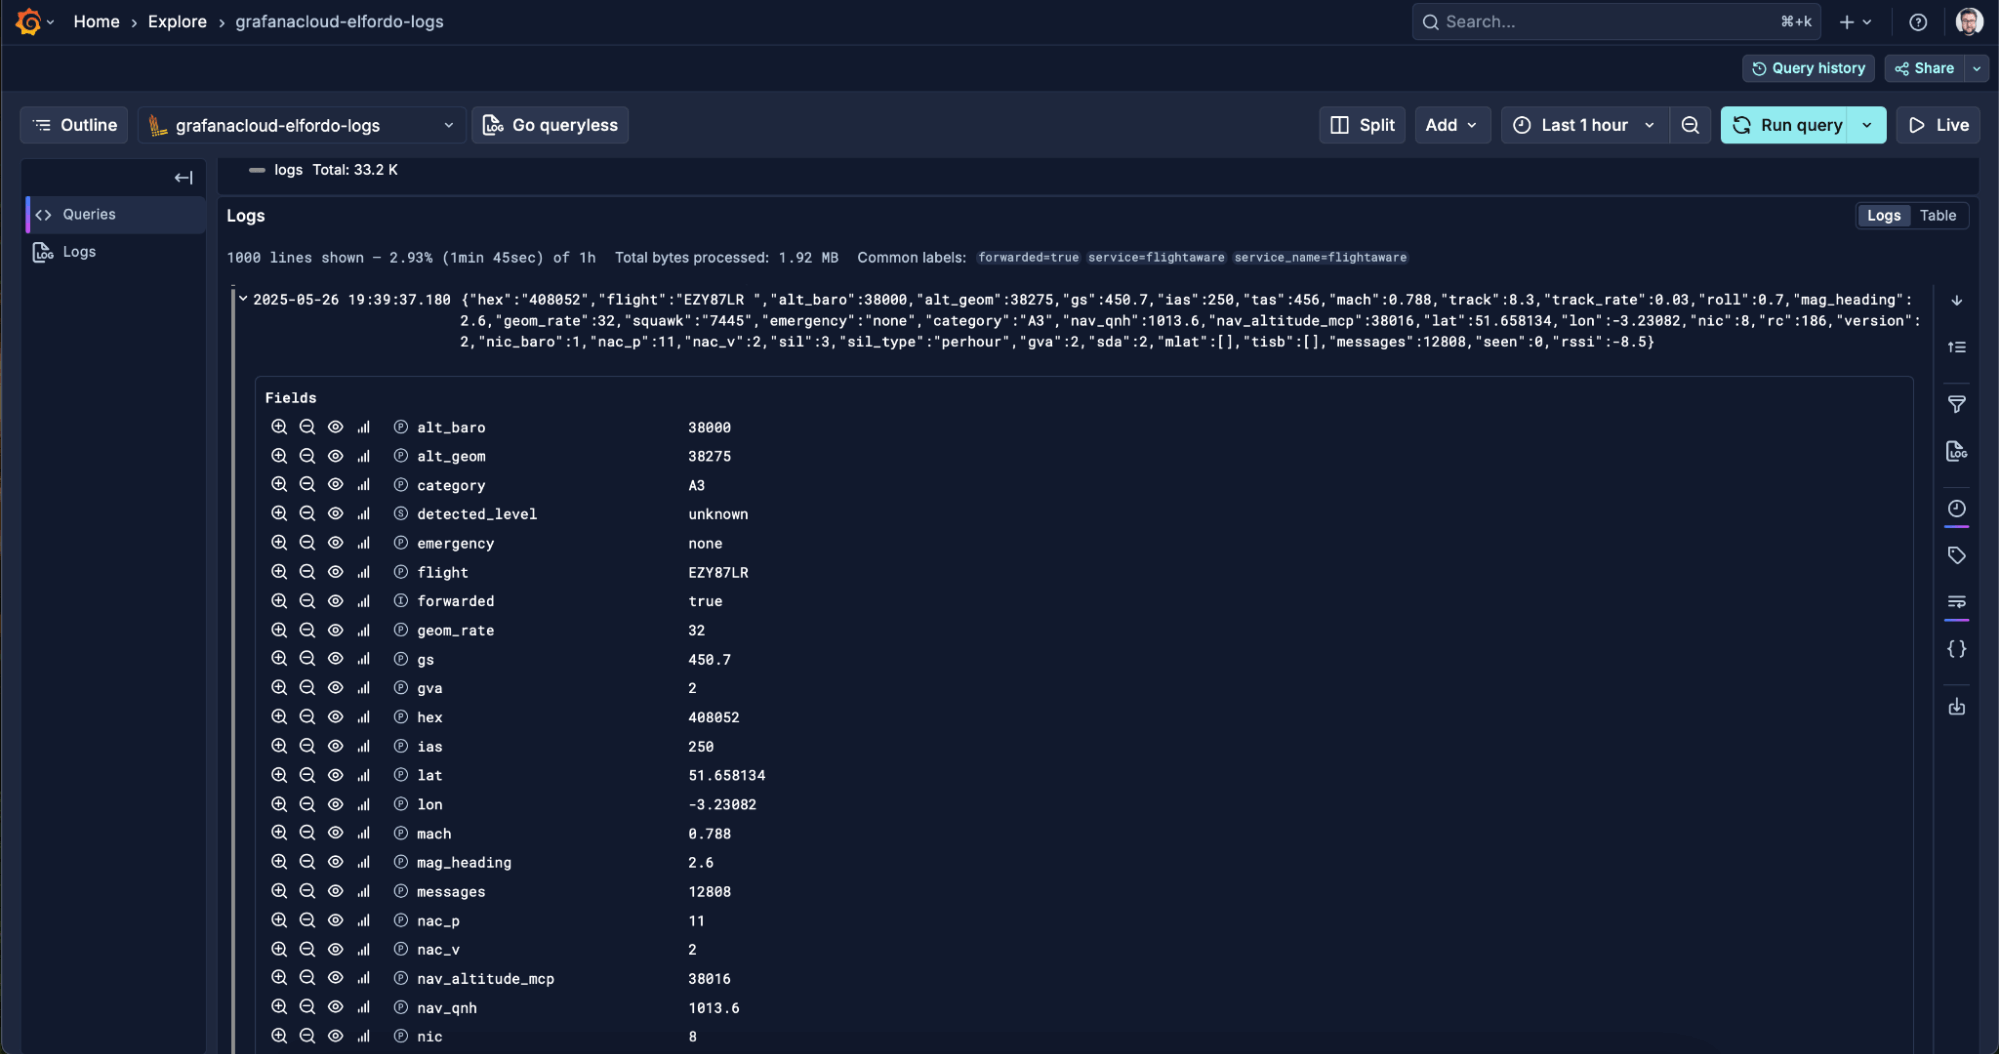
Visualizing the flight data
Now that the data is flowing, the fun really begins: visualizing it in Grafana. Fortunately, Grafana includes a powerful geomap visualization panel that’s perfect for this kind of use case. With its support for latitude and longitude fields, dynamic layers, and flexible styling, it’s an ideal fit for plotting aircraft positions on a live map.
Create the geomap panel
To set this up, create a new dashboard panel and select “Geomap” as the visualization type. In the query builder, configure your data source to pull the aircraft records you’ll need to extract at minimum the latitude, longitude, and timestamp fields. For enhanced functionality, also include aircraft identifiers, altitude, speed, and any other metadata you want to display in tooltips.
If you’re using adsb2loki, your query should look something like this:
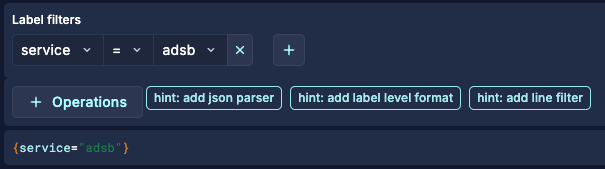
{service=”adsb}However, if you’re using another way of getting the data into Grafana Cloud Logs, you’ll need to set the label filter accordingly.
Apply the transformations
One thing I had to correct early on with my setup was to make Grafana only show the last position of the aircraft (otherwise the visualization looks really messy). To do this, there’s some simple transformations that need to be added.
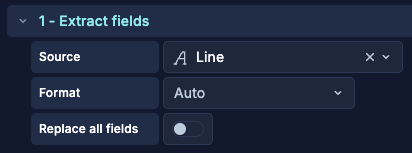
Extract the fields
Apply the “Extract fields” transformation, setting the source as “Line.” This will extract all the different fields in the log line and allow you to use them in later transformations.
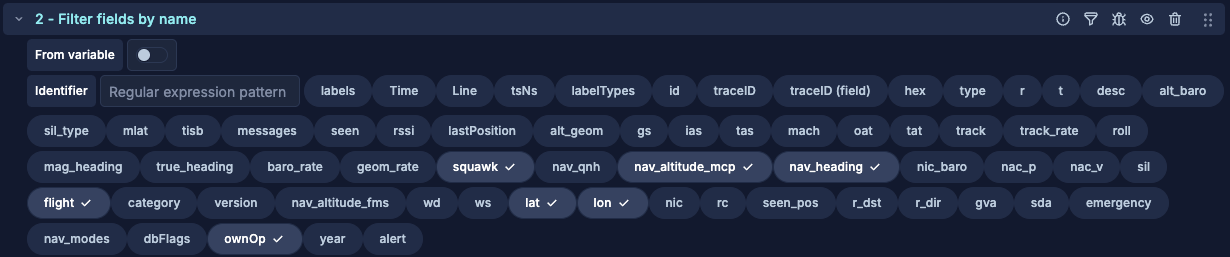
Filter out the fields you don’t need
By default there are a lot of fields in the aircraft data payloads that are unnecessary for our visualization. Therefore, the second transformation should be “Filter fields by name,” and choosing what you need. For the purposes of this project, I only have the following selected:
- Squawk
- Nav_altitude_mcp
- Flight
- Lat
- Lon
- Nav_heading
- ownOp
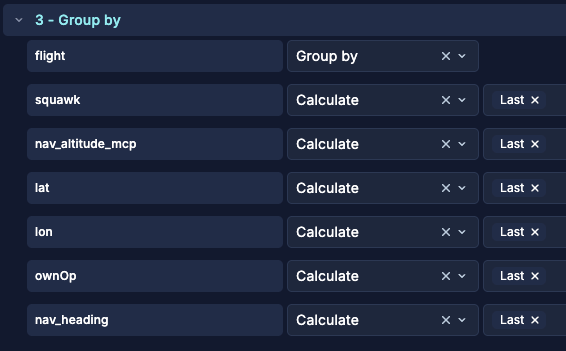
Setting the ‘Group by’
Finally, I only want to expose the last data point on the Geomap so that all aircraft have only one position on the map (the latest one uploaded).
Apply the “Group by” transformation, and then set the “flight” field to “Group by” and the other fields to “Calculate” and “Last.” This ensures that only the last log entry will be considered for visualization.
Apply the map layer configuration
Next, configure the “Map layer” settings in the geomap panel. Set the “Location Mode” to “Coords” and map your latitude and longitude fields to the appropriate data columns. Under “Style,” you can customize the marker appearance, choose markers (naturally, you’d want the plane one), adjust size based on altitude, or use different colors to represent aircraft types or speeds.

For real-time updates, enable the “dashboard auto-refresh interval” and set it to match your data ingestion frequency (in this case, every five seconds). This ensures that as new aircraft data arrives, the map automatically updates to show the latest positions overhead.
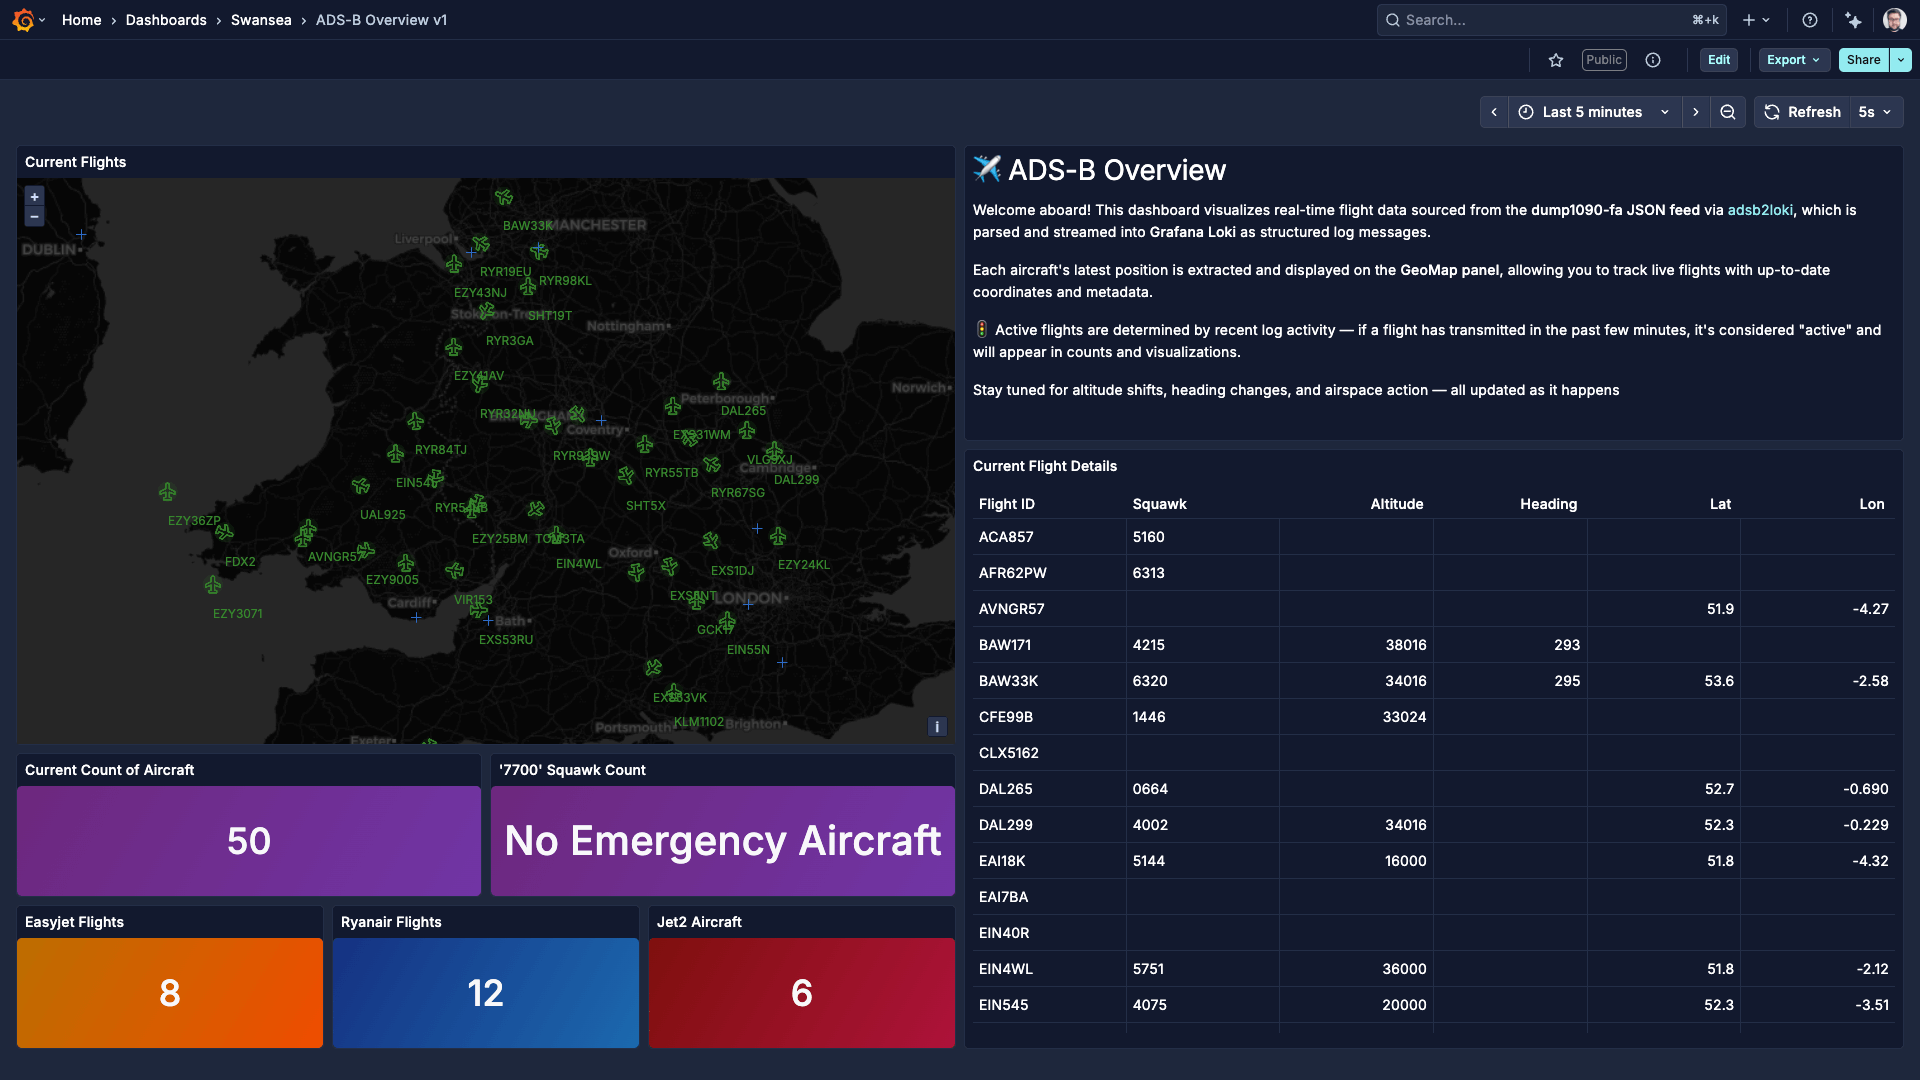
The result is a dynamic, real-time map displaying the aircraft your receiver can see along with their flight paths and details all rendered directly within Grafana’s familiar interface.
I will say that there seems to be something quite therapeutic about watching it refresh and having it on in the background while I get on with work. If you want to try it out yourself, visit my live dashboard here.
Bonus: If you want to take it a step further, Grafana has the ability to plot out airports on the map, too. Simply add another layer in “Map layers,” set the layer type to “GeoJSON” and set the URL to “public/gazetteer/airports.geojson”.
Final thoughts
If you happen to have a Raspberry Pi lying around, I highly recommend picking up a FlightAware or similar SDR dongle and feeding the data into Grafana. It’s a fantastic way to create a visually engaging dashboard that brings your data to life. I’ve made the adsb2loki Go app and dashboard file available via GitHub and released it as a Docker container, so feel free to check it out. PRs are also welcome!
It’s also worth pointing out that this is just one way of being able to track things using Grafana and leveraging the geomap visualization. You can track pretty much anything that exposes coordinates, as long as it’s getting stored in Grafana Cloud Logs.
I’m also pretty impressed by using the adsb.im feeder image for the Raspberry Pi. (It’s responsible for retrieving and decoding the data from the SDR, but it also makes it easy to feed sites such as Flightracker24, FlightAware, and much more.) It was so simple to just download the image, flash my SD card with it, then boot up the Raspberry Pi. A few minutes later everything was up and running. They also have a great set of documentation about running the feeder image, and some recommended hardware to run the image as well.
So, what’s next? I’m now exploring tracking trains—another exciting project that I’m eager to dive into. Stay tuned! (P.S. Shout out to my colleague Rob Knight, who provided me with the hardware to begin with, for working alongside me with this blog and also being a fellow aviation enthusiast!)
Grafana Cloud is the easiest way to get started with metrics, logs, traces, dashboards, and more. We have a generous forever-free tier and plans for every use case. Sign up for free now!


