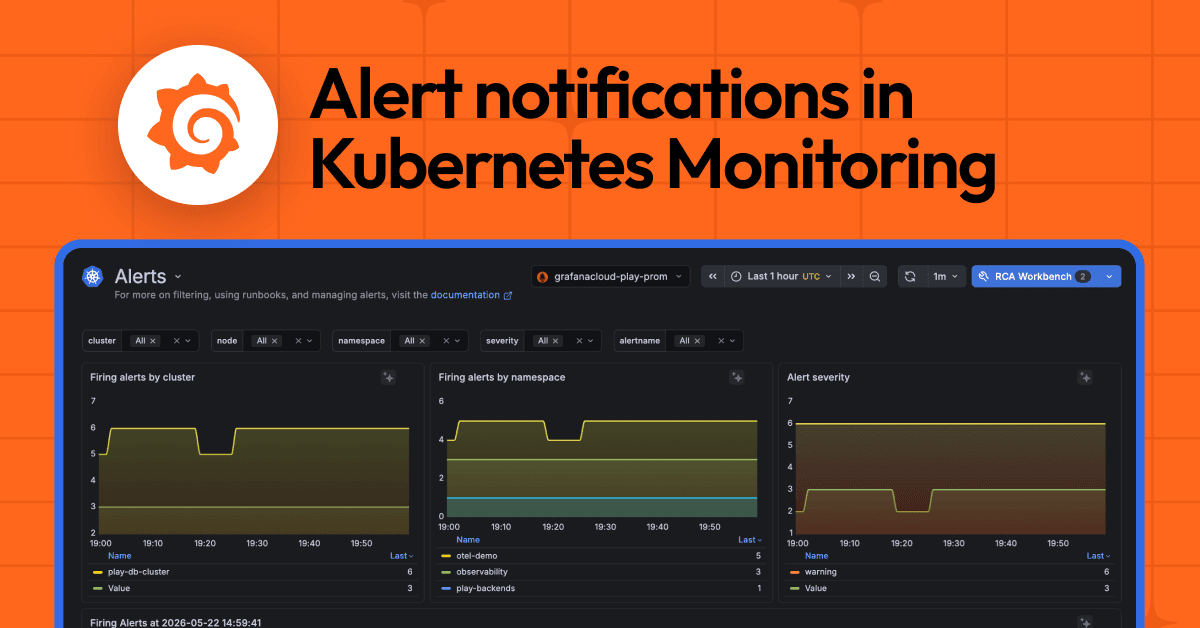
Kubernetes Monitoring backend 2.2: better cluster observability through new alert and recording rules
We’re excited to announce version 2.2.0 of the backend for our Kubernetes Monitoring solution in Grafana Cloud is now available.
The app’s backend is supported by kubernetes-mixin, an open source Prometheus Monitoring Mixin, and this latest version features significant improvements to alert rules and recording rules that will enhance your cluster observability and monitoring experience.
There’s a lot to tell you about, so let’s dive in.
Smarter alert rules: better signal, less noise
Enhanced alert context
One of the biggest improvements is the addition of cluster labels to alert descriptions where they were previously missing. This seemingly small change makes a huge difference when you’re managing multiple clusters—you’ll now instantly know which cluster is experiencing issues without having to dig through each additional cluster until you find the right one.
New alerts for critical scenarios
Along with the contributions from the community, we’ve introduced three new alert rules on existing scraped metrics that address common but previously un-alerted failure modes:
KubePdbNotEnoughHealthyPodsmonitors Pod Disruption Budgets to ensure you maintain enough healthy pods during maintenance or failures. The severity level is kept at warning level to keep paging noise levels low (by skl).KubeNodePressuredetects when node memory, disk, and/or PID is under pressure, where eviction thresholds have been reached (by TheRealNoob).KubeNodeEvictionalerts when pods are being evicted from nodes (by TheRealNoob).
Improved existing alerts
Several existing alerts have been refined for better accuracy and performance:
KubeletTooManyPodsnow de-duplicates pod counts and evaluates more efficiently, reducing false positives and rule evaluation load (by skl).KubeStatefulSetReplicasMismatchhas been enhanced to also trigger when pods cannot be created, not just when replica counts don’t match (by aeber).KubeNodeNotReadyandKubeNodeReadinessFlappingnow filter out cordoned nodes, eliminating noise from intentionally drained nodes (by TheRealNoob).
Reduced false positives
We’ve removed two alerts that were causing confusion:
KubeAPIDownandKubeletDown: Because they didn’t take multiple instances of each component into account, these alerts were often misleading. They’ve been removed to reduce alert fatigue.
More robust recording rules
Enhanced compatibility
All apiserver rules now support both Prometheus v2 and v3 histogram bucket formats, ensuring smooth operation regardless of your Prometheus version. This forward-compatibility means you won’t need to worry about breaking changes when upgrading your monitoring stack.
Better Data Quality
Updates to apiserver_request:availability30d now prevent null values, ensuring your availability calculations are always accurate and meaningful (by lorenzofelletti).
Support for all workload types
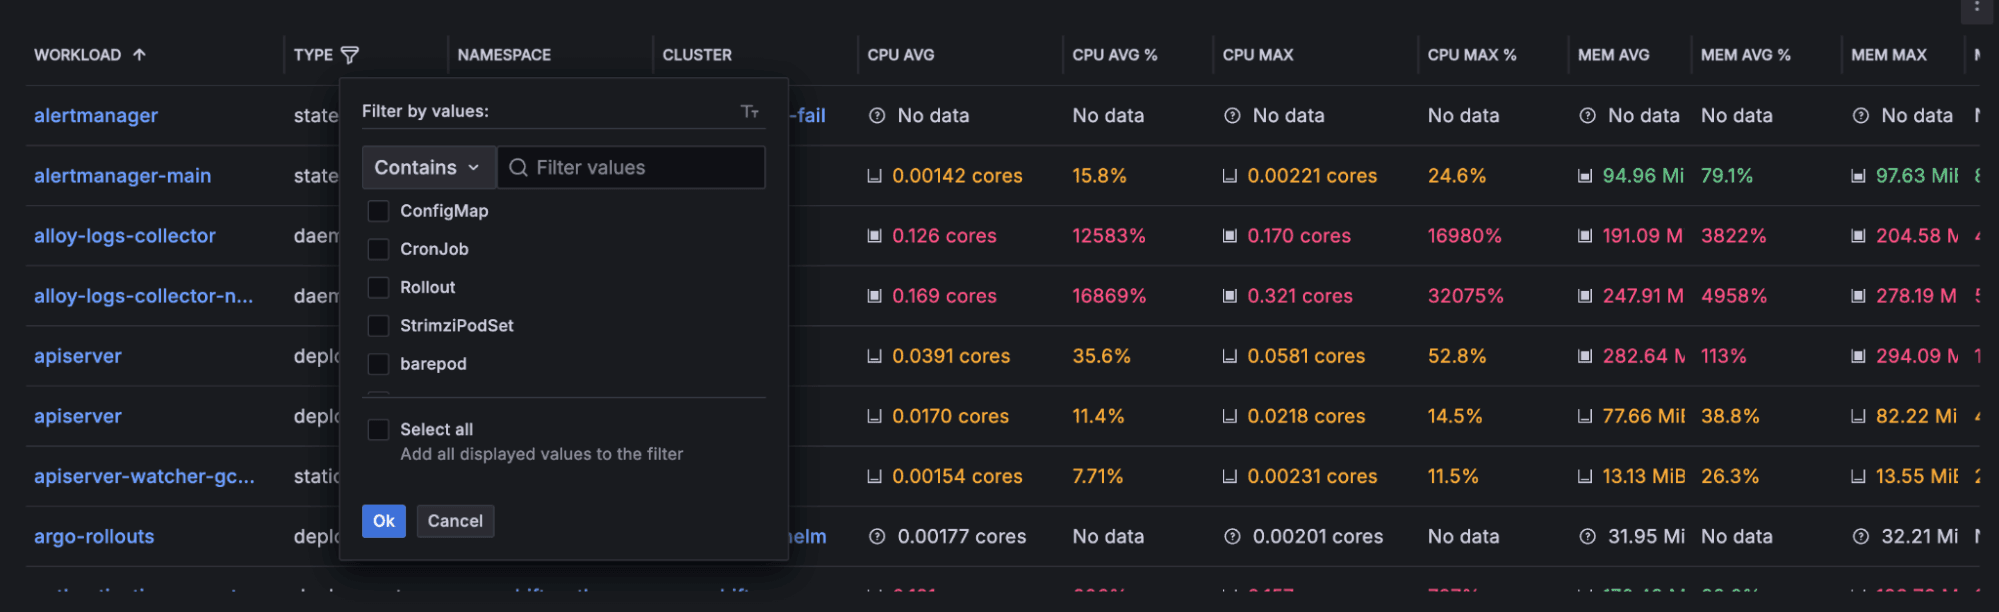
The Kubernetes Monitoring app has increased support for namespace_workload_pod:kube_pod_owner:relabel recording rule to support all workload types (by sleepyfoodie).
Version 2.1.0 was supported by kubernetes-mixin 1.1.0. In 1.1.0, the recording rule supported standard workload types. In kubernetes-mixin 1.2.0, the recording rule now supports non-standard workload types. The backend version 2.2.0 is now using kubernetes-mixin 1.2.0. With the support of non-standard workload types, our workloads page shows all the different types of workloads rather than categorizing all into the standard type.
In the mixin, a new rule is also created (by sleepyfoodie): node_namespace_pod_container:container_cpu_usage_seconds_total:sum_rate5m. It will eventually replace the irate version (node_namespace_pod_container:container_cpu_usage_seconds_total:sum_irate), which was misrepresenting data in the app, as it only uses the last two points of data in a time range, ignoring all the other points and making it noisier. The irate version also fails to capture spikes correctly. In the Prometheus documentation, it states that irate “should only be used when graphing volatile, fast-moving counters.” In contrast, rate will consider all available data points over a given time range.
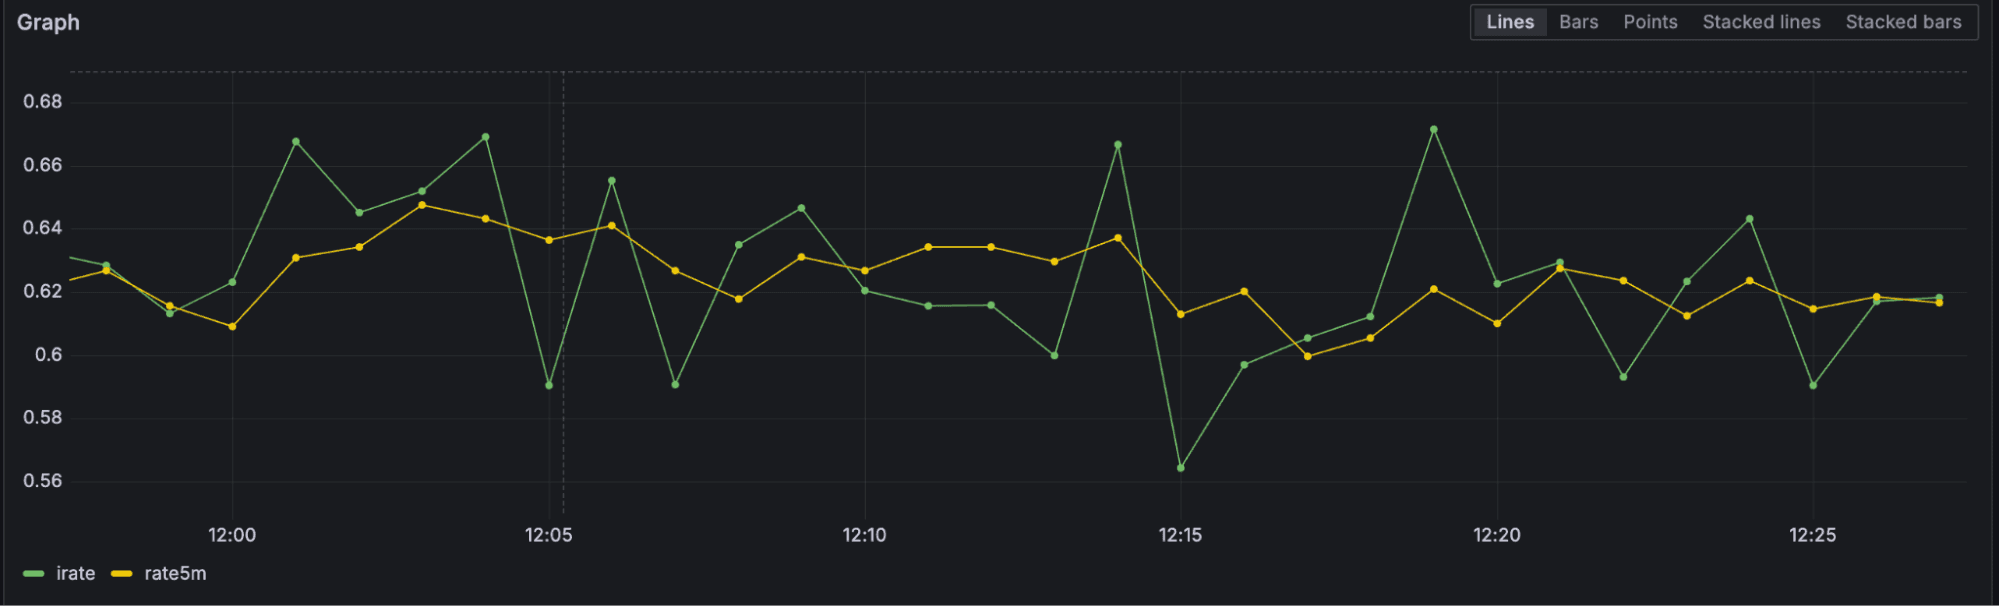
Although the mixin has both the existing and new rule for backwards compatibility, we deprecated node_namespace_pod_container:container_cpu_usage_seconds_total:sum_irate from our own recording rules in favor of the new, more efficient rate-based calculation. This change is part of our commitment to performance and best practices, and it reflects the monitoring community’s shift toward more stable and accurate metrics collection patterns.
Getting started
Version 2.2.0 is now available and ready for deployment. The new alerts will automatically start monitoring your cluster, while the improved recording rules will enhance your existing dashboards and queries.
Whether you’re running a small development cluster or managing large-scale production environments, these enhancements will help you maintain better visibility and control over your Kubernetes infrastructure.
And for detailed technical information and implementation specifics, check out the full changelog in kubernetes-mixin. Happy monitoring!
Grafana Cloud is the easiest way to get started with metrics, logs, traces, dashboards, and more. We have a generous forever-free tier and plans for every use case.Sign up for free now!