
Open source log monitoring: The concise guide to Grafana Loki
Five years ago today, Grafana Loki was introduced to the world on the KubeconNA 2018 stage when David Kaltschmidt, now a Senior Director of Engineering at Grafana Labs, clicked the button to make the Loki repo public live in front of the sold-out crowd. At the time, Loki was a prototype: We bolted together Grafana as a UI, Cortex internals, and Prometheus labels to find out if there was a need for a new open source tool to manage logs.
So was there a market for another log aggregation tool? Absolutely, without a doubt. And it’s only grown in popularity over the years. There are well over 100,000 active Loki clusters today; the project has surpassed 20,000 stars on GitHub; and we see Loki out in the wild in a wide range of use cases — whether it’s running on Raspberry Pis in homelabs or on massive multi-tenant clusters with tens of thousands of CPU cores. Above all, we are grateful for the community of almost 900 contributors who helped evolve this prototype into an impressive, extremely capable piece of software.
To celebrate the five-year anniversary of Loki, I thought it would be nice to summarize how our log aggregation tool has evolved over the years. I know I’ve certainly learned and evolved over these years too. My journey with Loki started just a few weeks after the launch announcement. In fact, I was interviewing with Grafana Labs that same day, having applied after seeing a “We’re hiring” banner on grafana.com while updating my homemade weather station.
In 2020 I wrote a blog called the Concise guide to labels, which I feel might be the most useful content I’ve created for Loki—short and sweet, focused, easy to share and consume. Over the next few weeks I aim to produce a series of posts in a similar style around several Loki topics (Disclaimer: The order and exact content may change, they haven’t been written yet 😏):
- Labels: What’s changed since 2020
- Log ordering and ingesting older data
- Query performance: A crash course on how to query 300+GB/s
- Caching 101 (and maybe 201)
- Retention and deletes
- Sizing
A lot has changed since 2018. Loki’s internals have been iterated over and replaced in some cases several times; however, conceptually it hasn’t changed much at all. So to start this series let’s talk about the concept of Loki, what it was designed for (and what it wasn’t), and what it eventually will be.
Welcome to the concise guide to Loki.
What Loki was designed for
The concept was fairly simple: leverage the categorization system of Prometheus labels, the single pane of glass provided by Grafana, and the cloud native distributed system design of Cortex to build a logging system that is highly scalable and very Kubernetes-friendly.
There was one additional piece here which I think really made Loki the obvious choice in Kubernetes clusters around the world: Promtail, a simple agent that leveraged the same service discovery used by Prometheus. This made it really easy to automatically find and categorize your logs with the same labels you were using to organize your metrics.
The goal here was to make a simple, fast, easy-to-use tool that allows developers and operators to quickly find their application logs using Prometheus metrics, narrow down their searches, and pivot to the logs behind those metrics.
Log ingestion
The real world of logs is incredibly chaotic. Almost no two applications, even if they’re the same type, agree on how to generate logs, so we wanted Loki to be extremely accommodating to this real world problem. As such, Loki was built with a very simple data model: It stores everything as a string.
Having an entirely schema-less, structureless data model makes ingestion as easy as possible—no agreement on log format, schemas, or structure is necessary. Instead, Loki adopts the approach of parsing and adding structure to logs at query time, often called “schema at query.”
We wanted Loki to be very fast and very cost effective to ingest logs. Getting log information with no delays is critical to making operational decisions, and it’s very important for generating metrics and alerts. Loki has no preprocessing requirements. It can be incredibly fast while keeping costs low at ingestion. Using the default settings in Grafana Agent, logs have a typical creation-to-read latency of less than 2s.
We also wanted Loki to scale easily, quickly, and without limits. This is why it’s built as a distributed system, which allows for easy insertion of more hardware to quickly handle more load.
Indexing logs
One traditional operational complexity of databases is managing a large index. Often they are hard to partition horizontally leaving you with requirements for very expensive, very “tall” machines with hundreds of GB of RAM and/or extremely fast local disks.

Loki was designed to build a very small index. We only index the Prometheus-style labels that define what we call a log stream.
Labels are an important concept within Loki, which is why they will get their own dedicated post. The important difference to note between Loki and a lot of other existing logging systems is that Loki does not index the content of the log line. This allows the index to be orders of magnitude smaller than the data, which means you likely will only need a few hundred MB to index 20+TB of data. Small index files also mean it’s easier to use more commodity compute; you don’t need machines with hundreds of GB of RAM.
Log storage
One of the worst problems of database operation in my opinion is managing disks, running out of disk space, dealing with disk performance, dealing with disk failures, and the associated redundancy models—especially for time series data which grows forever onward.

Five years ago, Loki was unique at the time for being one of the first databases designed and built primarily using object storage (S3, GCS, Blob) as its main storage mechanism. In other words, no disks to manage. Cloud provider object storage systems are remarkable pieces of technology, and by using them, you get access to incredibly high-performance, high-SLA, high-durability, low-cost, no-hassle storage.
Log querying
Loki includes a query engine capable of deserializing json, parsing logfmt, or pattern/regex matching the patterns in your log lines. This allows you to add structure to your logs at query time, which means you can filter, aggregate, graph, summarize, etc. all of your content regardless of the format it’s in.
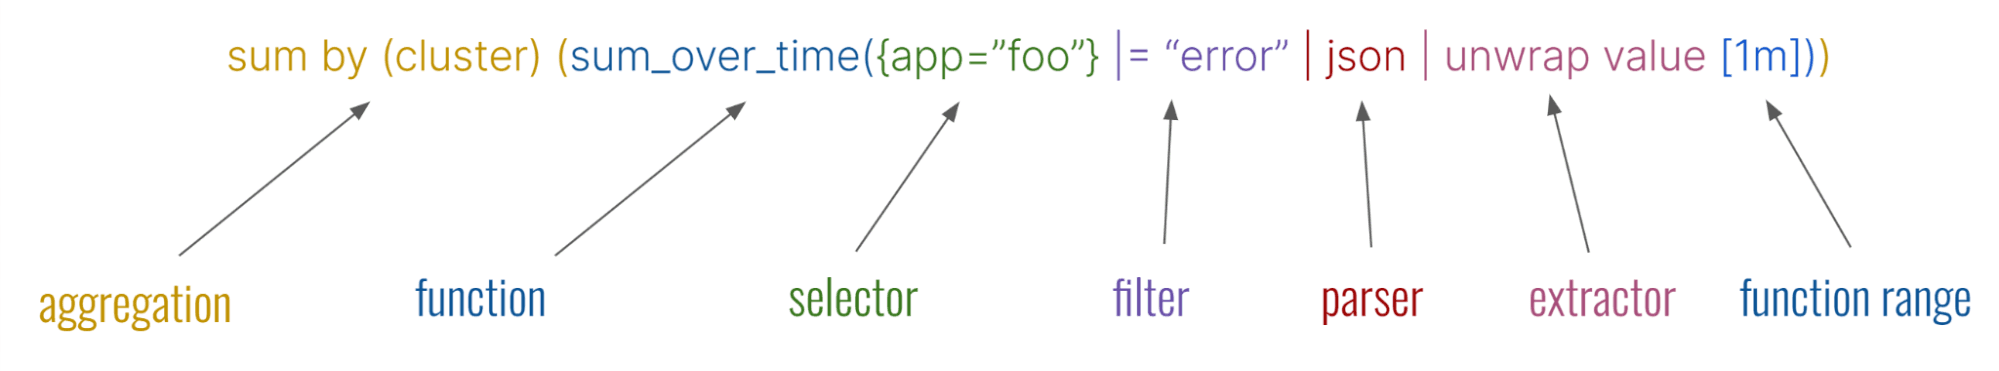
The query language, LogQL, is a combination of command line style pipes for manipulating logs and Prometheus-inspired functions for creating time series graphs of your data. The idea behind LogQL was to build a query language that would feel intuitive for folks who were familiar with working at a command line for processing their logs, and Prometheus for querying their metrics.

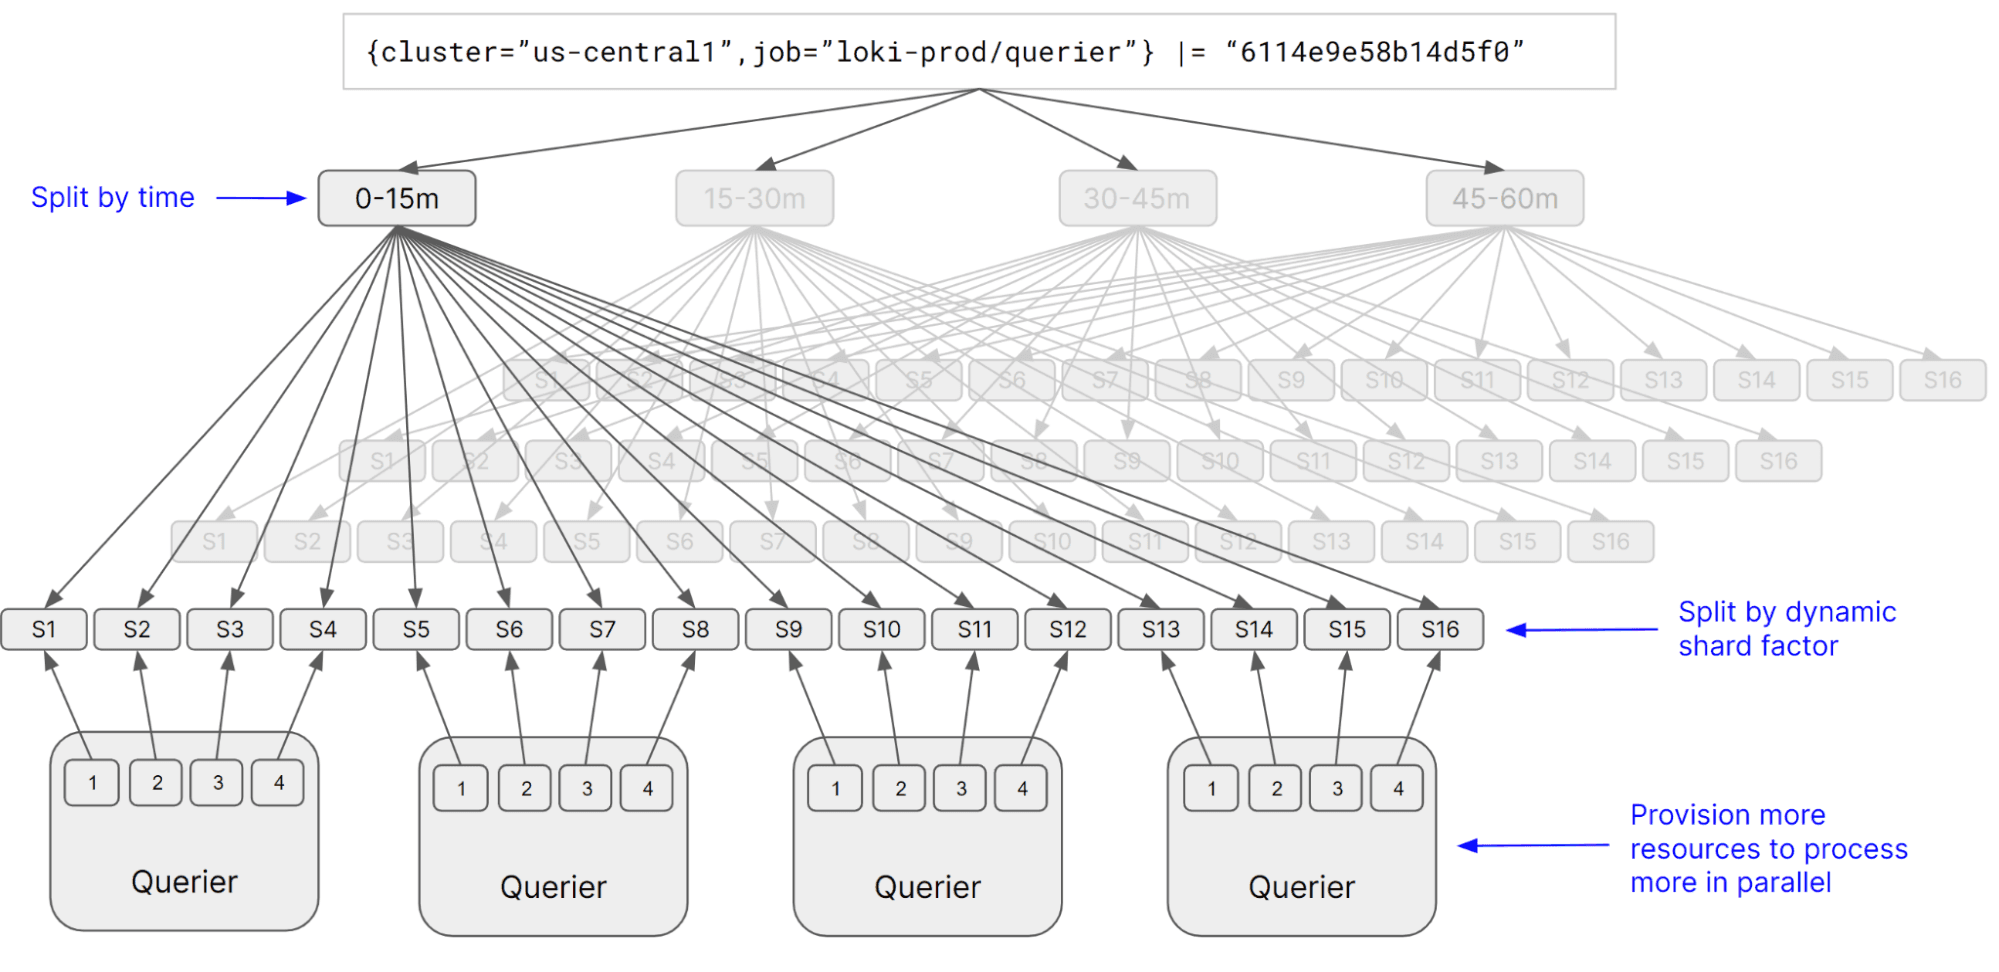
Query performance is obtained by using a tremendous amount of parallelization, splitting queries into smaller subqueries which can all be executed at the same time. It’s a common misconception that a large index is necessary to make queries fast. However, Loki can process your data at hundreds of gigabytes per second by using thousands of parallel workers. These workers can be cost effective, too, by leveraging spot instances and only being provisioned on demand to meet query load.
What Loki was not designed for
Every database is making trade-offs around where to spend time and money, how to store data, how to index it, how to re-index it, how to re-store it in a different format, etc. They also make trade-offs on operational complexity and complexity of use (such as deciding on schemas). The bigger your data volumes get, the more you need to align your database design with your goals. I’ve learned a lot about this over the last few years as I watched Loki grow from ingesting hundreds of GB a day to hundreds of TB a day.
Columnar vs. row-oriented databases
Loki is a row-oriented database. This makes it fast for row operations, such as inserting and reading entire rows. However, some log types, such as access logs, event logs, or other similar highly structured data, can be much more efficiently stored in columnar type databases.
Columnar databases allow you to fetch only parts of the original log lines, or just the columns you need for your query. This can save you from having to fetch large amounts of data as well as make it easier to do certain types of analytical queries on this kind of highly structured data.
Loki can still efficiently and quickly query highly structured data, but because it has to fetch the entire row, when your queries start to process terabytes or tens of terabytes of logs, columnar stores are likely better suited for this use case.
Also because Loki does “schema at query,” it has to do more processing at query time. If you have workloads that query the same data again and again, hundreds or thousands of times over, this can start to prove expensive compared to a database that pays upfront to structure and store data more closely aligned with how it’s queried.
Looking ahead, this is one area I do expect Loki to continue to evolve. We’ve already built prototypes for columnar storage as well as things like materialized views. I think ultimately Loki will combine both row and columnar storage to suit a world of both highly chaotic and highly structured data.
Loki five years later: what’s changed
Really not a lot has changed from Loki’s original design. It’s working. People like it. We’re trying hard to limit adding complexity unless we really think it’s needed. But there are a few places, that have seen important changes, so let’s talk about those.
Better log ingestion and OpenTelemetry support
Very recently we have introduced something we are calling structured metadata. We extended the storage model to allow storing structured key=value pairs alongside the log string. This was critical for better native OpenTelemetry support to Loki. Structured metadata also addresses some difficult workloads where you need to keep some very high cardinality identifiers that don’t already exist in the log line. Before you either had to store them as a label or modify the log line to insert them. Now, there is a place for this data to be stored, outside of the index, without having to modify your log lines.
Improved log indexing
Conceptually we still only index labels identifying your logs by stream, but Loki has seen internal evolution of the index implementation several times over the year.
We are in the process of adding some additional “indexing” to Loki. I use that word a bit loosely because what we are really doing is leveraging Bloom filters to tell Loki where it does NOT have to look when executing queries. Bloom filters are being added specifically to target a common query use case we see in Loki we call “needle in a haystack” queries. This is the type of query looking for a very small number of log lines, usually containing something highly unique like a UUID over a very large set of data.
Log storage: then and now
Not much has changed here. Object storage is still great, and we still love it.
What’s next for querying
The query language in Loki has evolved over time to support more and more complex queries and use cases; however, at the same time, we see a growing demand for a less complicated query experience. We are currently building prototypes for querying Loki that do not require any query language knowledge.
We are also looking at ways to improve parallelization of certain types of queries that currently cannot be parallelized because they can’t do so without being inaccurate. There are probabilistic data structures that can be used in scenarios where a fast result over large amounts of data is preferred over perfect accuracy.
Why Grafana Loki has been so successful

The world of logging is incredibly fascinating, with seemingly no two companies exactly alike in the shape, size, and volume of logs they produce or in how they use those logs. If anyone told me five years ago I’d be running Loki clusters with more than 10,000 cores I don’t know what I would have said.
What I can say now is this: The real world of logs is incredibly chaotic and varies in scale from bytes to petabytes a day. I think a tool like Loki has been so successful because it’s so flexible. Not having any schema while being able to scale from running a single binary to a massive multi-tenant distributed system makes Loki a really good solution for a really large number of people.
With this Loki blog series, I hope to provide valuable content for more people to come to the same conclusion. Come back next week to join me in revisiting the concise guide to labels in Loki!
Grafana Cloud is the easiest way to get started with metrics, logs, traces, dashboards, and more. We have a generous forever-free tier and plans for every use case. Sign up for free now!

