Grafana 12.3 release: Interactive learning experiences, new and improved logs visualizations, and...
Grafana 12.3 delivers a new interactive learning experience, tons of data visualization updates, and more. Here are the highlights.
Read more
News, releases, technical articles, cool stories, and more.
Drilldown Investigations will be deprecated from Grafana OSS and removed from Grafana Cloud in January. Get the details and see what alternatives are...
Read more
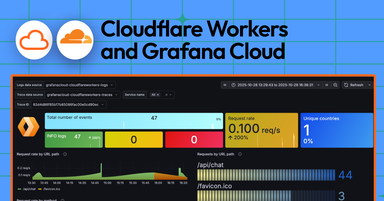
Easily export OpenTelemetry traces and logs from Cloudflare Workers to Grafana Cloud for deeper application observability, no code changes required.
Read more
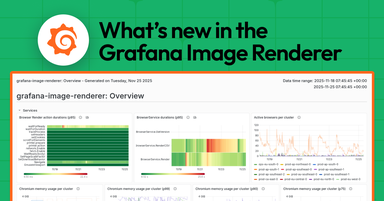
The latest major release of the Grafana Image Renderer delivers a number of updates that make the backend service more performant and reliable. Here’s...
Read more
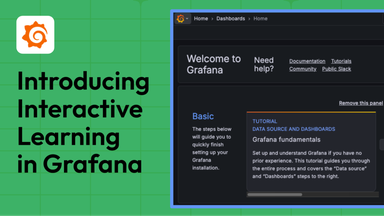
With Interactive Learning, we bring helpful and contextual learning resources into the Grafana platform, so you can find what you’re looking for...
Read more
Grafana 12.3 delivers a new interactive learning experience, tons of data visualization updates, and more. Here are the highlights.
Read more
Grafana Mimir 3.0 marks a new era for the open source time series database, delivering dramatic improvements in both reliability and performance.
Read more
The latest release of Grafana Tempo brings a number of exciting updates, including MCP server support, which lets you leverage LLMs to access and...
Read more
Grafana 12.2 includes a more intuitive, LLM-powered experience for SQL expressions, data visualization updates, and so much more. Here are the...
Read more
Ask Grot, your blog librarian
Need help finding content to answer your questions? Try our AI chat bot, Grot (beta).
The latest major release of the Grafana Image Renderer delivers a number of updates that make the backend service more performant and reliable. Here’s...
Read more
With Interactive Learning, we bring helpful and contextual learning resources into the Grafana platform, so you can find what you’re looking for...
Read more
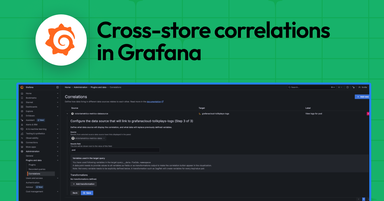
Learn how easy it is to start using correlations with third-party data in Grafana. Jump from a chart to logs or traces with one click—no copying and...
Read more
Easily export OpenTelemetry traces and logs from Cloudflare Workers to Grafana Cloud for deeper application observability, no code changes required.
Read more
The latest major release of the Grafana Image Renderer delivers a number of updates that make the backend service more performant and reliable. Here’s...
Read more
With Interactive Learning, we bring helpful and contextual learning resources into the Grafana platform, so you can find what you’re looking for...
Read more
Drilldown Investigations will be deprecated from Grafana OSS and removed from Grafana Cloud in January. Get the details and see what alternatives are...
Read more
Easily export OpenTelemetry traces and logs from Cloudflare Workers to Grafana Cloud for deeper application observability, no code changes required.
Read more
The latest major release of the Grafana Image Renderer delivers a number of updates that make the backend service more performant and reliable. Here’s...
Read more
With Interactive Learning, we bring helpful and contextual learning resources into the Grafana platform, so you can find what you’re looking for...
Read more
With Grafana Cloud Service Center, teams can quickly discern whether services are performing well, identify areas requiring attention, and set...
Read more
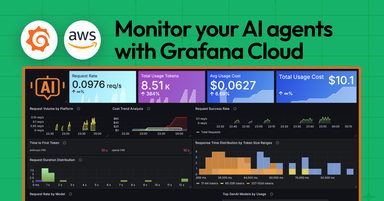
Learn how to use OpenTelemetry, Amazon CloudWatch, and Grafana Cloud to track essential performance and financial metrics for Amazon Bedrock...
Read more
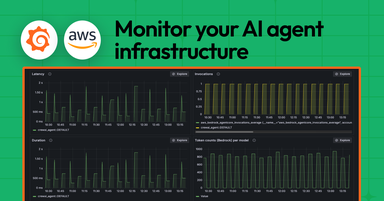
Learn how to use OpenTelemetry and Grafana Cloud AI Observability to track your Amazon Bedrock AgentCore agents to debug production issues and...
Read more
It’s official: GrafanaCON, our biggest community event of the year, will take place 20-22 April, 2026 in Barcelona. Can’t wait to see you there!
Read more
The new Temporal Cloud integration for Grafana Cloud gives teams a simple way to visualize, monitor, and alert on the health of their Temporal...
Read more
Learn how easy it is to start using correlations with third-party data in Grafana. Jump from a chart to logs or traces with one click—no copying and...
Read more
Register today for ObservabilityCON on the Road, a one-day version of our flagship observability event that we’re bringing to a city near you in 2026.
Read more
Grafana 12.3 delivers a new interactive learning experience, tons of data visualization updates, and more. Here are the highlights.
Read more
Along with the release of Grafana Enterprise 12.3, we are releasing updated versions of Grafana Enterprise 12.2.1, 12.1.3 and 12.0.6, all of which...
Read more
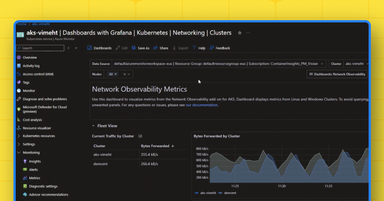
The Azure Monitor dashboards with Grafana service, now generally available, enables Azure users to create and edit Grafana dashboards directly within...
Read more
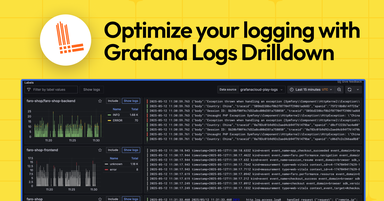
Whether you're new to Loki or highly proficient in LogQL, see how Grafana Drilldown can help accelerate troubleshooting and reduce MTTR for your...
Read more

