Video: Top three features of the new Loki 2.0
Hi folks, Ward Bekker here from the Solutions Engineering team. I’ve just published a video on the new Loki 2.0 release that I’m excited to share with you.
The Loki team announced the brand-new Grafana Loki 2.0 release at last week’s ObservabilityCON conference. It’s an exciting, feature-packed release. Loki’s slogan — like Prometheus, but for logs — is more true than ever before.
In the video below, I’ll give you a quick look at my favorite three features of this release:
- Say goodbye to your external index. Single store Loki is now ready for production.
- Complement Prometheus with high-cardinality Loki metrics.
- Alert on your logs with powerful Prometheus-style alerting rules.
Let me know what you think of the new Loki release — looking forward to your feedback in the video comments section!
Try out the NGINX web analytics dashboard yourself
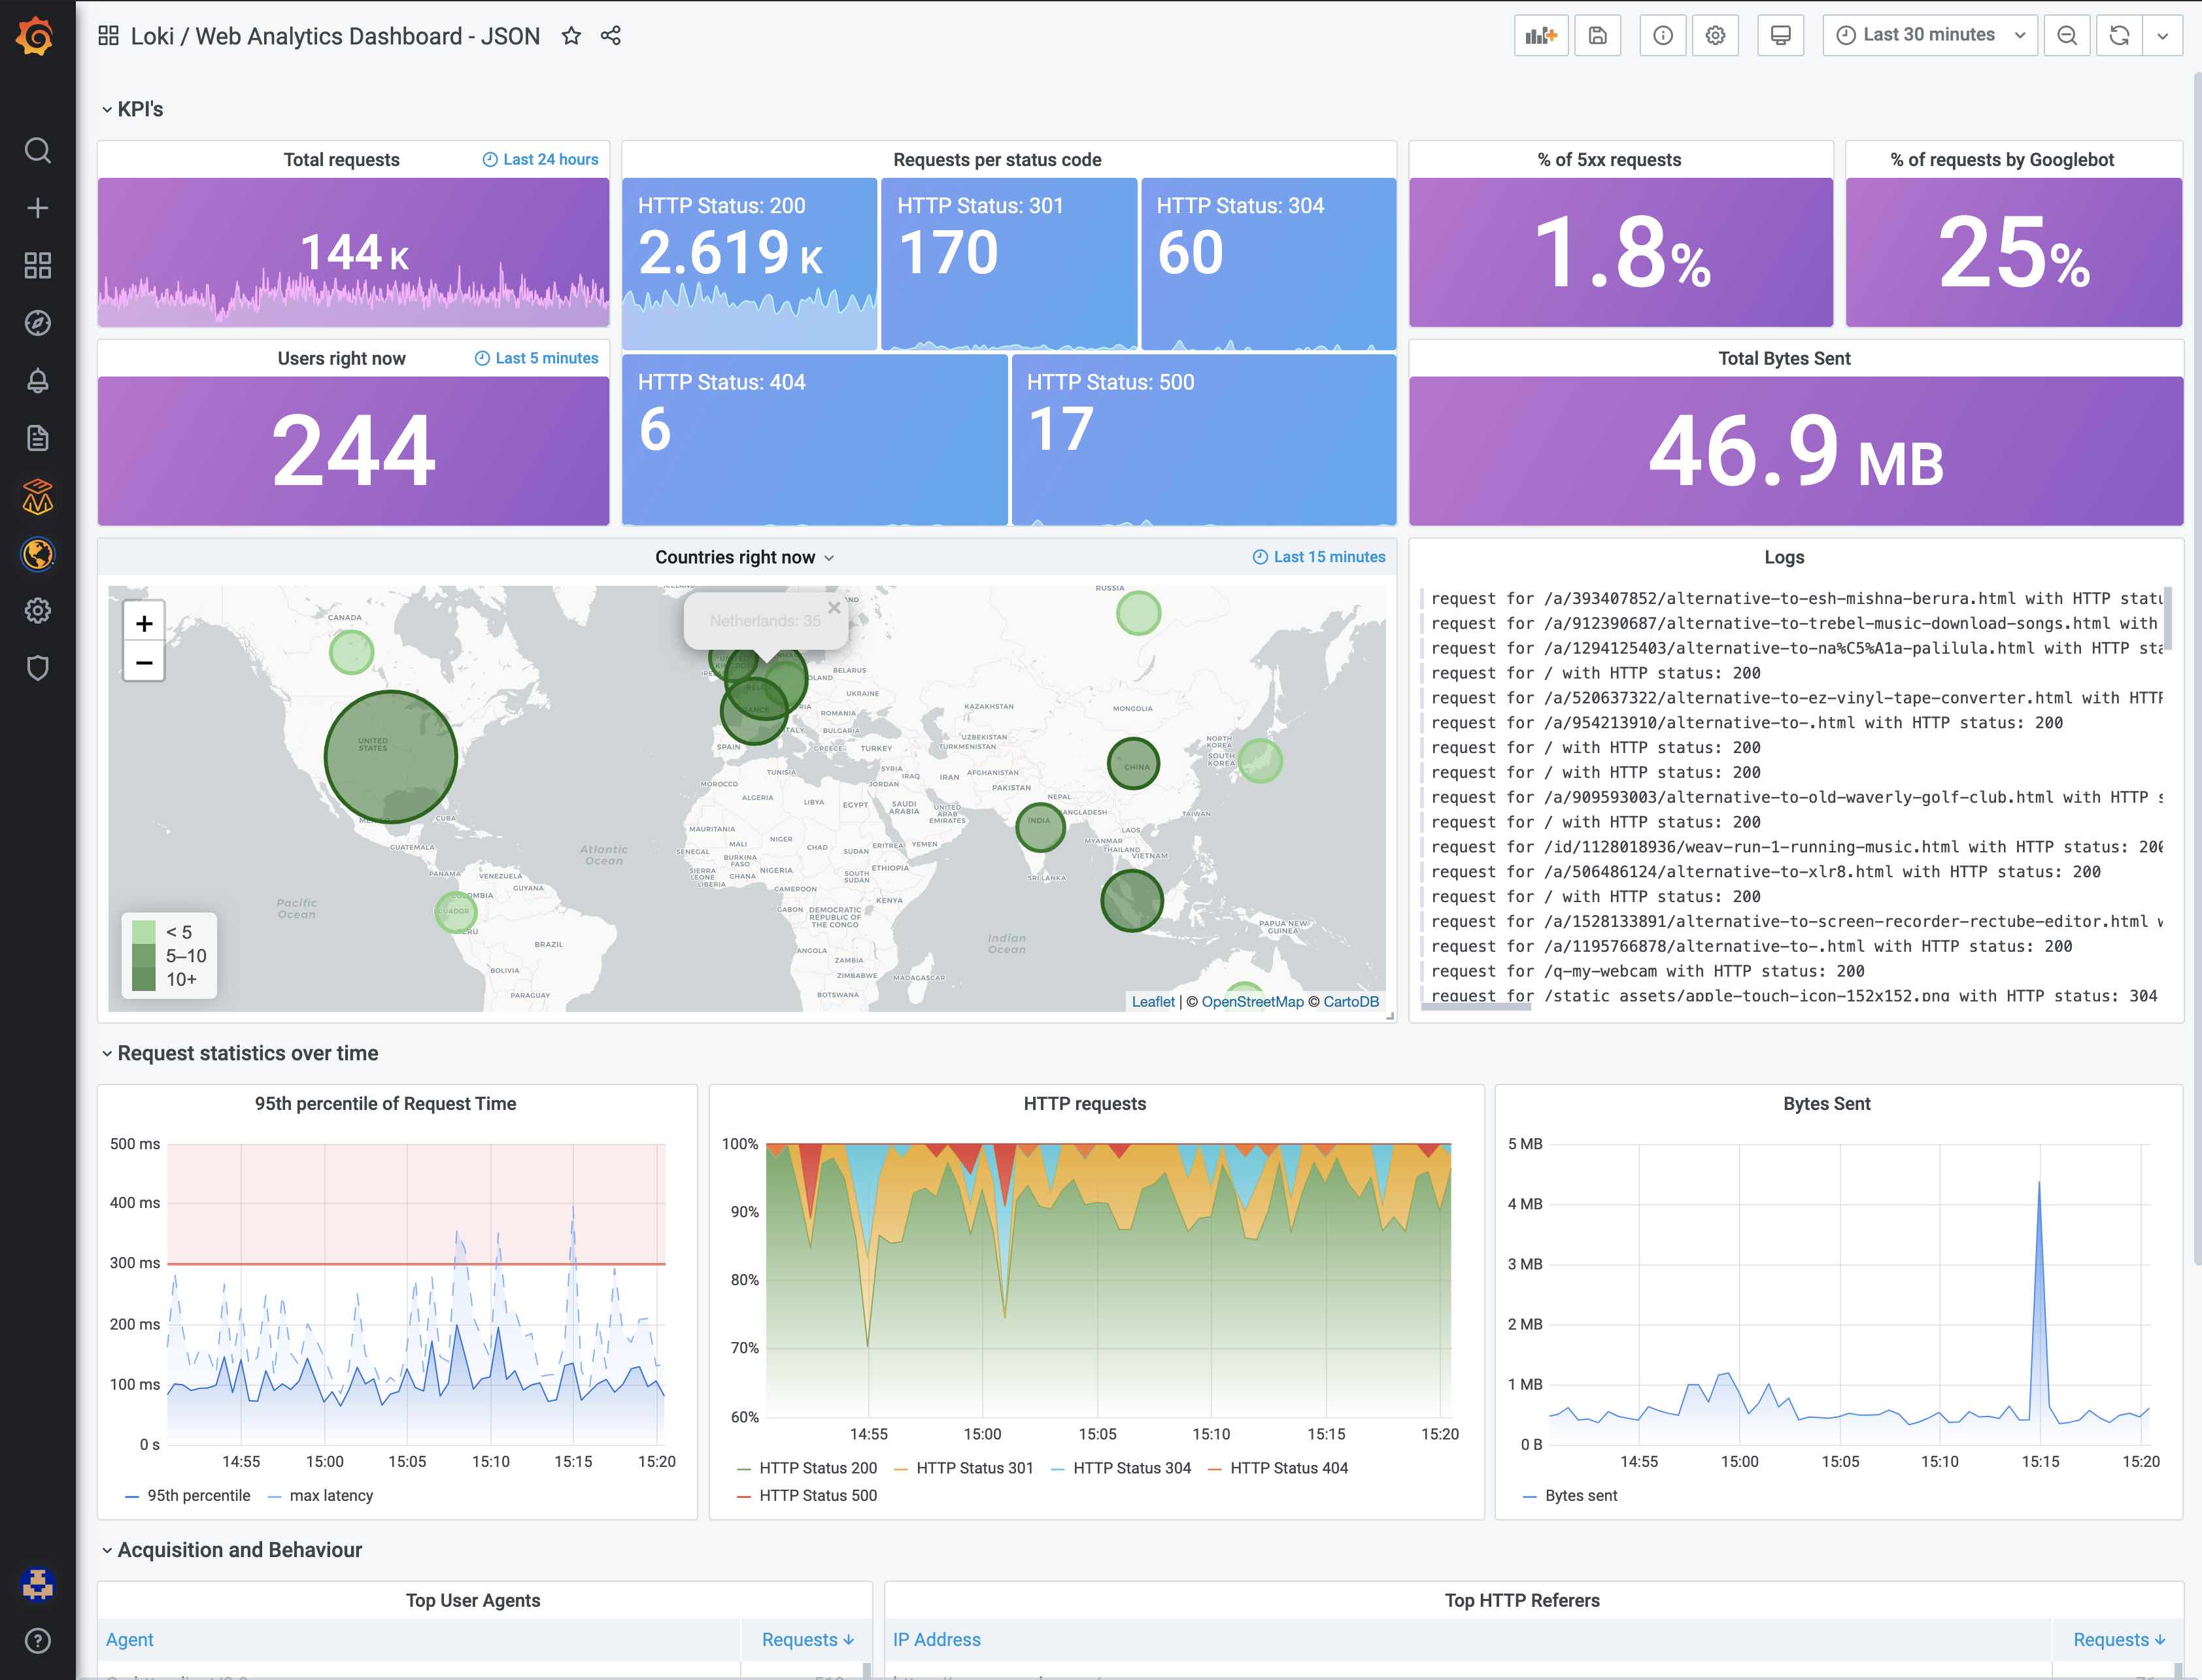
The NGINX dashboard in the video only uses raw NGINX access logs and the power of Loki 2.0. You can download it here and try it out on your own NGINX logs. Let me know what you think of it!
Get started with Loki 2.0 today
Try out Loki v2.0 by installing it yourself or by signing up for a 30-day free trial of Grafana Cloud. The free trial comes with 50GB of logs, and you get access to the new Grafana Cloud Alerting add-on for powerful Prometheus-style alerting on your logs.
For more on the 2.0 release, watch the on-demand video of the ObservabilityCON session, Observability with logs & Grafana.
Thank you to Dave Schmid, who kindly created the Loki dashboard animation.