
How blocks storage in Cortex reduces operational complexity for running Prometheus at massive scale
Cortex is a long-term distributed storage for Prometheus. It provides horizontal scalability, high availability, multi-tenancy and blazing fast query performances when querying high cardinality series or large time ranges.
Today, there are massive Cortex clusters storing tens to hundreds of millions of active series with a 99.5 percentile query latency below 2.5s. However, the architecture that allows for this scale may add significant operational complexity, and make it difficult to implement some features like per-tenant retention or deletions.
In this blog post, I will talk about the work we’ve done over the past year on Cortex blocks storage to help solve this problem.
Background
The typical setup is having one or more Prometheus servers configured to remote-write the scraped series to Cortex, and then configuring Grafana (or your querying tool of choice) to query back the data from Cortex. In this scenario, Prometheus can be configured with a very short retention because all the queries are actually served by Cortex itself.
Cortex exposes a 100% Prometheus-compatible API, so any client tool capable of querying Prometheus can also be used to run the same exact queries against Cortex.

Cortex historically required two backend storages for the time series data: an object store for chunks of compressed timestamp-value pairs, and an index store to look up these chunks by series labels matchers.
This architecture works and scales very well. However, running a large and scalable index store may add significant operational complexity, and storing per-series chunks in the chunks store generates millions of objects per day and makes it difficult implementing some features like per-tenant retention or deletions.
Finding a solution
Nearly a year ago, in the Cortex community, we started brainstorming about removing the need to run an index store completely and instead storing all the time series data as blocks in the object store.
And then, one day, something magical happened: Thor Hansen – out of the blue – submitted a PR to introduce an alternative Cortex storage engine based on Prometheus TSDB and a few Thanos core components: shipper and bucket store.
Though it was a proof of concept, the PR looked promising and proved the feasibility of removing the index store dependency without compromising the two main characteristics that made Cortex famous: scalability and performance.
It took us 9 more months of hard work to stabilize and scale out the blocks storage. We introduced two new Cortex services – the compactor and store-gateway – with sharding capabilities, we added three layers of caching (index, chunks, and metadata cache), we backported most of the Cortex features like rate limits or operational tooling, and we’ve done countless optimizations and bug fixes.
Today, the Cortex blocks storage is still marked experimental, but at Grafana Labs we’re already running it at scale in few of our clusters, and we expect to mark it stable pretty soon.
Are you ready to go down the rabbit hole to find out the current state of Cortex blocks storage? Let’s go!
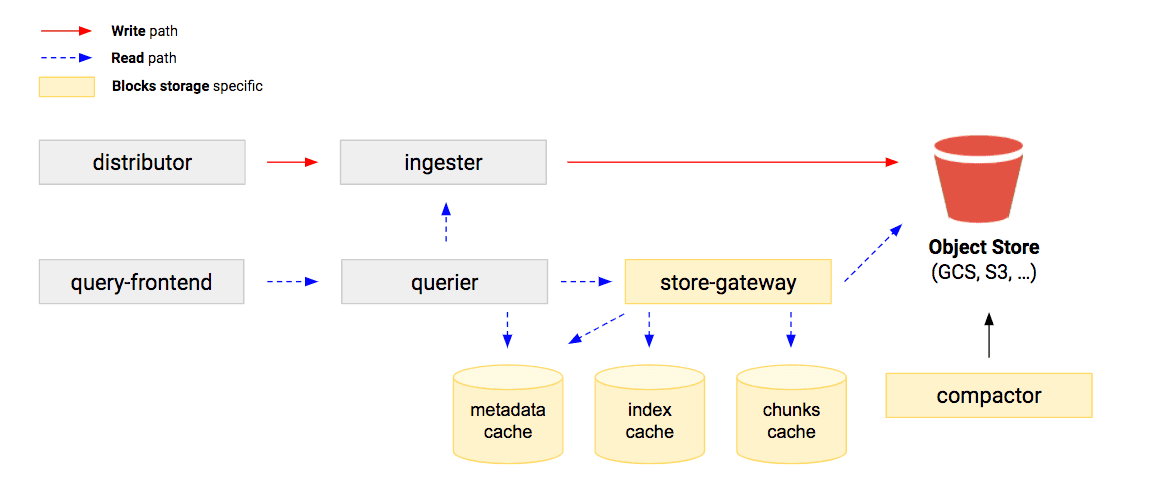
The 10,000-foot view
The Cortex architecture doesn’t change much between chunks (default) and blocks storage, except for a couple of additional services used by the blocks storage: compactor and store-gateway.
For the sake of clarity, I’m going to talk about different Cortex services as if they’re deployed as individual microservices, but keep in mind that Cortex also supports the so-called single binary mode where all these services are hidden within a single process that you can easily deploy and scale out. Whether you deploy Cortex in microservices or single binary mode, the architecture of how individual internal services interact with each other doesn’t change.
The write path
The distributor is the ingress for the write path. You typically have a load balancer in front of a pool of distributors, and your Prometheus servers are configured to remote-write to the distributor through the load balancer.
The distributor is responsible for validating the received series and samples, then sharding and replicating them across a pool of ingesters.
Finally, ingesters are responsible for storing the received series to the long-term storage. To do it, an ingester opens a dedicated per-tenant TSDB where samples are appended. Received samples are both kept in-memory and written to a write-ahead log (WAL) used to recover the in-memory series in case the ingester abruptly terminates.
The in-memory samples are periodically flushed to disk – and the WAL truncated – when a new TSDB block is created, which by default occurs every two hours. Each newly created block is then uploaded to the long-term storage and kept in the ingester for a slightly longer time, in order to give queriers and store-gateways enough time to discover the new block on the storage.
Given that the received samples are replicated by the distributors to ingesters, typically by a factor of 3, completely losing a single ingester will not lead to any data loss, and thus the WAL wouldn’t be required. However, the WAL is used as a last line of defense in case multiple ingesters fail at the same time, like in a cluster-wide outage.
The read path
The query frontend is the ingress for the read path. You typically have a load balancer in front of two query frontends, and Grafana (or your querying tool of choice) is configured to run queries against the query frontend through the load balancer.
The query frontend is where the first layer of query optimization happens. Given a large time range query, for example 30 days, the query frontend splits the query into 30 queries, each covering 1 day. Each splitted query is concurrently executed by queriers.
The query frontend also offers other capabilities, like start and end timestamp alignment, to make the query cacheable, and supports partial results caching. Together, these features enable blazing fast recurring queries.
The querier is responsible for executing a single query. It has a full view over the metadata of TSDB blocks stored in the object store (e.g., the ID and min/max timestamp of samples within each block), which it keeps updated by periodically scanning the bucket. (There’s a caching layer in front of it.)
At query time, the querier fetches recently received samples (that are not flushed to the storage yet) directly from ingesters and older samples from the object store through the store gateway. The fetched series and samples are de-duplicated and passed to the PromQL engine to execute the query.
To fetch samples from the long-term storage, the querier analyzes the query start and end time range to compute a list of all known blocks containing at least one sample within this time range. Given the list of blocks, the querier then computes a set of store-gateway instances holding these blocks and sends a request to each matching store-gateway instance asking to fetch all the samples for the series matching the query within the start and end time range.
The request sent to each store gateway contains the list of block IDs that are expected to be queried, and the response sent back by the store gateway to the querier contains the list of block IDs that were actually queried. The querier runs a consistency check on responses received from the store gateways to ensure all expected blocks have been queried; if not, the querier tries to fetch samples for missing blocks from different store gateways, and if the consistency check fails after all retries, the query execution will fail as well. Correctness is always guaranteed.
Summary
At Grafana Labs, we’ve been running the blocks storage for a few months now in clusters with several tens of millions of active series, and our confidence level is pretty high. As engineers, we’re used to focusing mostly on issues and things to improve, but if we zoom out and look at the big picture, it’s in pretty good shape!
To give you an example, for the past few months, we have been running an experiment where the same exact series (about 10M active series) are written to two Cortex clusters, one running the chunks storage and one the blocks storage. All queries are sent to both clusters using the Cortex query-tee, making them compete in terms of performance. The blocks storage doesn’t perform that bad; take a look for yourself!

We’ll cover more details in subsequent blog posts over the next few weeks, but before leaving, let me mention that all this work is not a one-man show. It’s the result of a collaborative effort of a group of people involving Peter Stibrany (Cortex maintainer), Ganesh Vernekar (Prometheus maintainer), the Thanos community captained by Bartek Plotka (Thanos co-author), the Cortex community, and me. In fact, this work was the start of a closer collaboration between the Thanos and Cortex projects, which Bartek and I recently talked about at PromCon Online.
It’s really wonderful working on a daily basis with such great people, and I feel very grateful for having the opportunity to be on their side. If all of this sounds interesting to you, consider joining us: We’re hiring!
Finally, let me remind you that if you’re looking for a managed solution to scale out your Prometheus, Cortex is the underlying technology powering the Grafana Cloud Hosted Metrics for Prometheus service. Check it out!
Thanks for reading, and see you soon!

