Analyze your GitHub Project With Elasticsearch And Grafana
The Dream
I have, for a long time, wished there was a way to easily export GitHub issues and comments to Elasticsearch. The standard GitHub graphs for commits and traffic are great but I have really been missing graphs and analytics on issues and comments.
If we had issues & comments in Elasticsearch, with a well-defined index mapping, we could do some interesting analytics. For example:
- Look at project history in terms of issues created
- Look at project history in terms of comments (can be a measure of community engagement)
- See how different labels trend over time.
- Look at distributions (histograms) on the number of issues or comments created per user. Are there a few very active users that represent 70% or 90% of all issues & comments?
- How long do PRs stay open?
- How long until issues get their first response?
Why Elasticsearch?
Grafana is most often used with time series databases like Graphite, but for this sort of use case, it’s about much more than measurements. Part of the power of Grafana is bringing together data from many different places, and leveraging the strengths of its diverse set of data sources.
Elasticsearch isn’t technically a time series database, but it’s been one of our fastest growing data source because it really shines for use cases like this. Plus, Grafana’s support for Elasticsearch is getting better and better.
Elasticsearch is not only a document search DB. Its real power is in the kinds of aggregations you can do. It’s not ideal for the high volume & high-resolution time series workloads that most time series databases can handle, but for data with high cardinality (like documents with usernames, issue numbers, etc) it can really shine. It also allows you to do ad-hoc filtering in a way that time series would not allow, as it would require a unique time series for every possible filter condition and value.
The GitHub API Crawler
So a few weekends ago I had some left over programming energy and spent a few hours hacking together this node.js app that uses the GitHub API to crawl all issues and comments which it then saves as separate documents in Elasticsearch.
It stores them in Elasticsearch with this index mapping:
"mappings": {
  "issue": {
    "properties": {
      "title":            { "type": "text"  },
        "state":            { "type": "keyword"  },
        "repo":             { "type": "keyword"  },
        "labels":           { "type": "keyword"  },
        "number":           { "type": "keyword"  },
        "comments":         { "type": "long"  },
        "assignee":         { "type": "keyword"  },
        "user_login":       { "type": "keyword"  },
        "milestone":        { "type": "keyword"  },
        "created_at":       { "type": "date"  },
        "closed_at":        { "type": "date"  },
        "updated_at":       { "type": "date"  },
        "is_pull_request":  { "type": "boolean"  },
    }
  },
    "comment": {
      "properties": {
        "issue":           { "type": "keyword"  },
        "repo":            { "type": "keyword"  },
        "user_login":      { "type": "keyword"  },
        "created_at":      { "type": "date"     },
      }
    }
}
There are some more numeric fields being saved for reactions that do not need to be defined in the index mapping.
The Dashboards
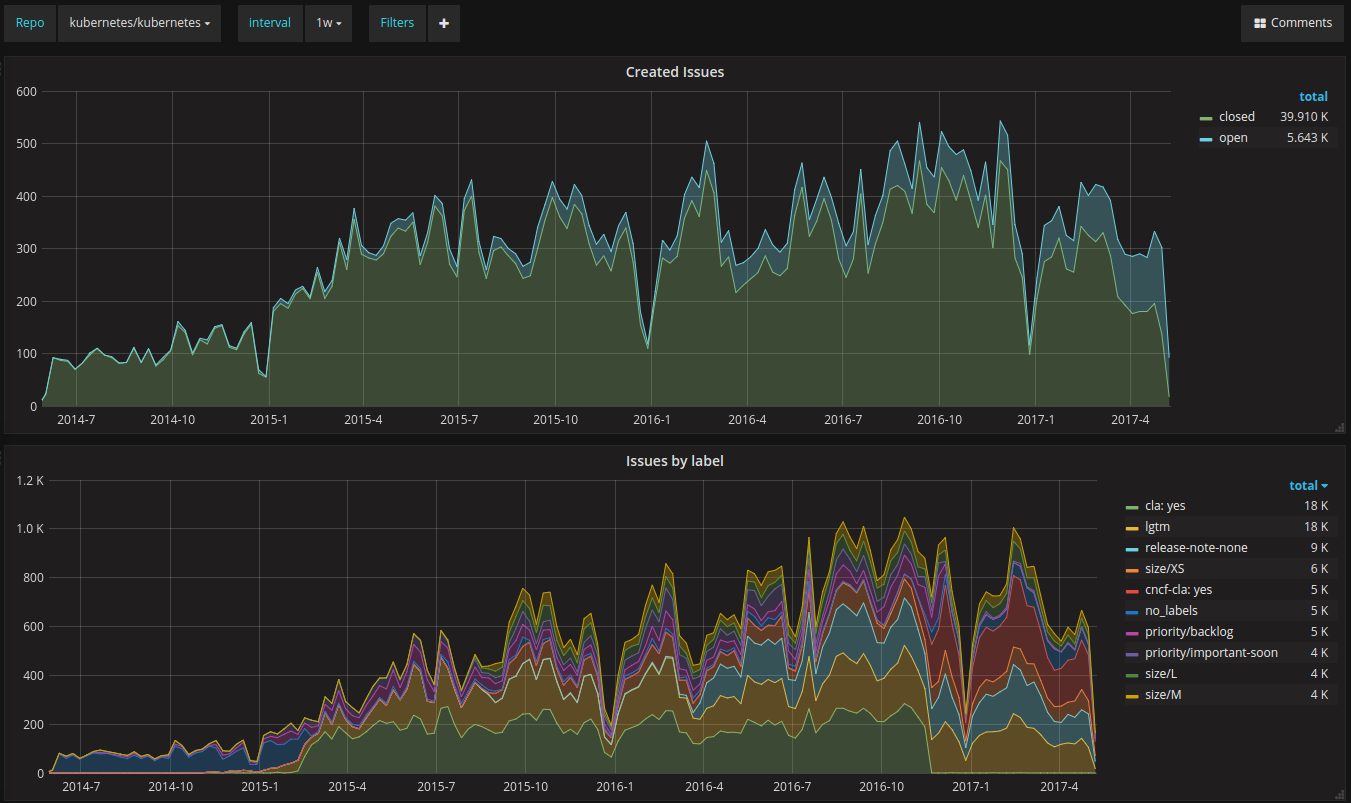
With the data finally collected, I built two dashboards; one focused on issues and another one focused on comments. Both dashboards are templated and allow you to specify which repository to look at and the granularity (group by time) of the data. You can also add any ad-hoc filter. For example, only look at issues created by a specific user, or only look at issues with no comments.

Check out the dasboard on our play site. I configured the github-to-es collector to fetch issues and comments for the main Kubernetes repo, the main Grafana repo and the Microsoft VS Code editor repository.
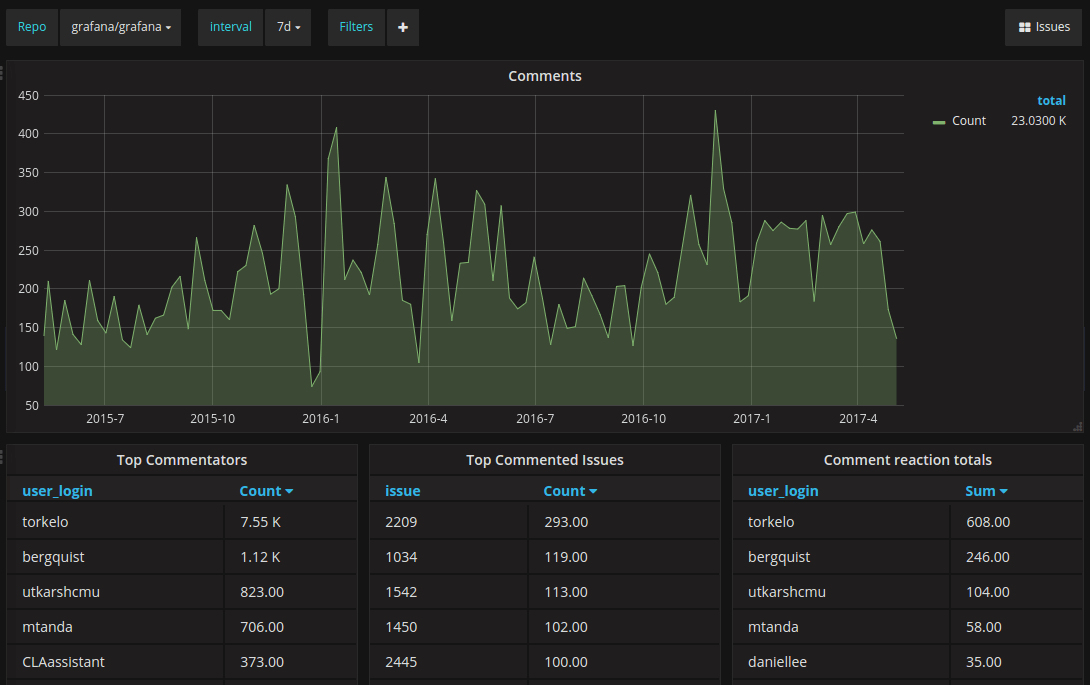
The second dashboard shows comment analytics:

Useful How?
I am not exactly sure how useful this data & dashboards are yet. It was mostly a fun hobby project to see some trends and stats for issue and comment volume. But this could also be useful data that can help you track things like issue label stats. Stats that could be used to improve categorizing issues and visualizing changes in labeling trends. For example, the graphs could answer questions like: How did a concerted effort to improve docs change the trend of issues labeled question?
Try it and help me improve it
Check out the GitHub repo grafana/github-to-es it has a basic README with instructions for how to get started.
Once you have the import working you need to add an Elasticsearch data source in Grafana. For index name you specify github
and for the Timestamp field you specify created_at. Then you can import the the two dashboards i published on Grafana.com:
There are some limitations for how many issues and comments that can be imported in the initial full import due to the paging limit in the GitHub API. GitHub API returns a maximum of 100 issues or comments per “page” and has a page limit of a maximum of 400 pages. This means that the full import can only handle 40,000 issues and 40,000 comments.
More data & more cool graphs
There are probably many more interesting queries you can build and the collector could also be improved to fetch and store more fields.
For example:
- Collect stars & fork stats (needs to be recorded as snapshot docs as there is no API to get historical data for this)
- Calculate time between issue created and first comment during issue fetching to have that as a field on the issue docs
- PR details, currently issue API does not include merge status (only a flag if its a PR)
- Commit docs
There are probably a lot more cool things you can collect & query.
Until next time, keep on graphing!
Torkel Ödegaard
Grafana Creator & Project Lead


