

Grafana 1.6.0 released.
New release today! v1.6.0 is now available for download.
This is a pretty big release with a many of small improvements and new features.
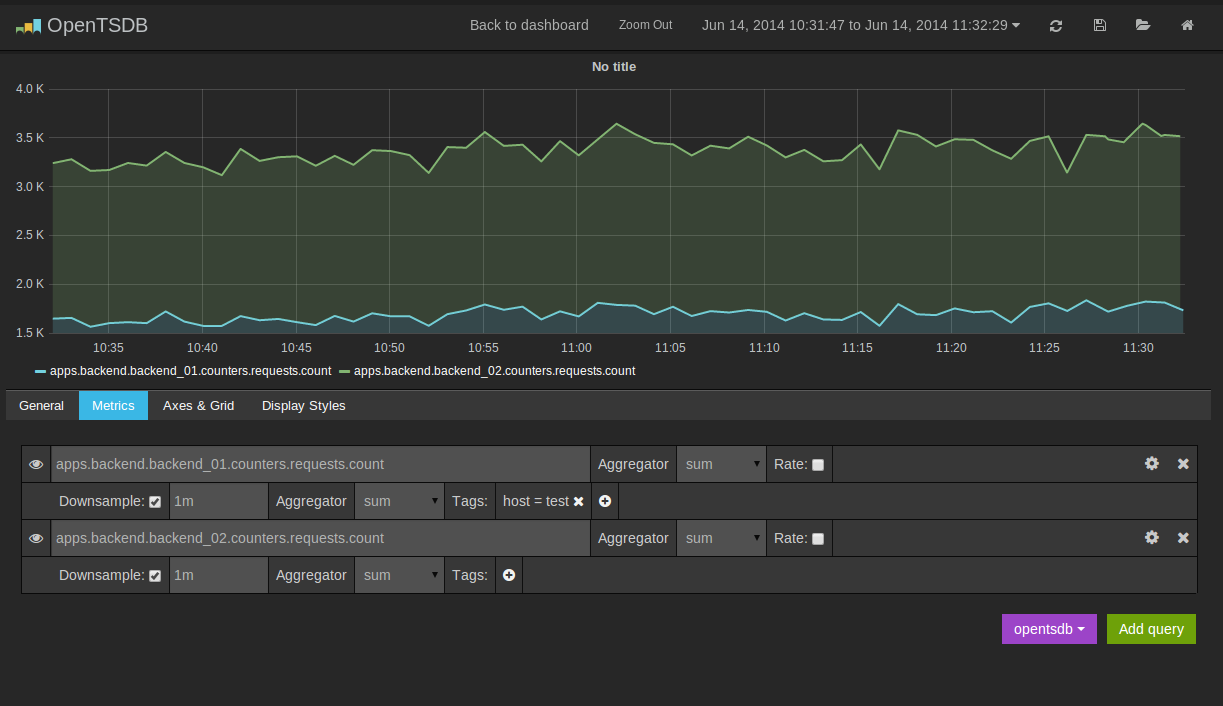
OpenTSDB
This release marks the first release with initial support for OpenTSDB as a metrics datasource. Checkout the docs article for how to configure opentsdb.
Dashboard editing improvements
Adding, moving and changing row settings as well as adding panels is much improved. The row edit icon on the right of the row has been changed into a menu with quick options to move the panel up/down, set height, add panel and delete.
InfluxDB query editor improvements
The query editor is enhanced and more space efficient.

InfluxDB group by
You can now group a single influxdb series into many grafana series by clicking on the plus icon and specifying a column to group by.

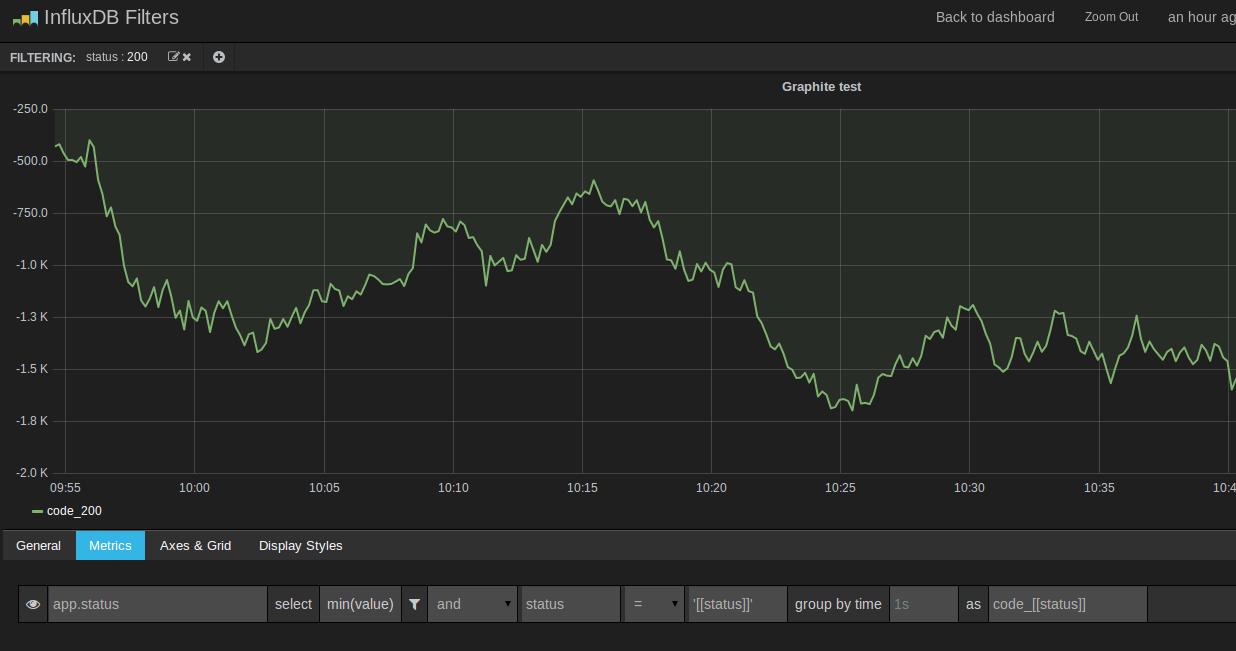
InfluxDB filtering/templated queries
You can now use the filtering feature (templated queries) with InfluxDB.
Changes
The graphite panel is now renamed to simply graph. Old dashboards will still work.
There are many more changes and improvements, checkout the complete changelog on the download page.


