

Grafana 1.5.3 released.
Just pushed a new release! v1.5.3 is now available for download. There is no big new feature, just a collection of small improvements and bugfixes. Been too busy making this new site to have time for any big new features.
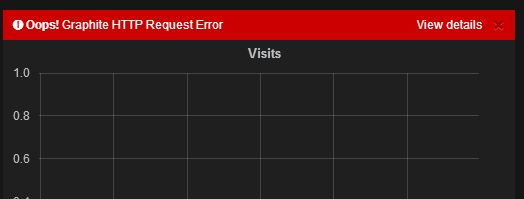
Some notable new features in this release is a new error inspector. Now when you get the "Oops! Graphite HTTP Request Error" banner
you will also get a view details link that will open the inspector.
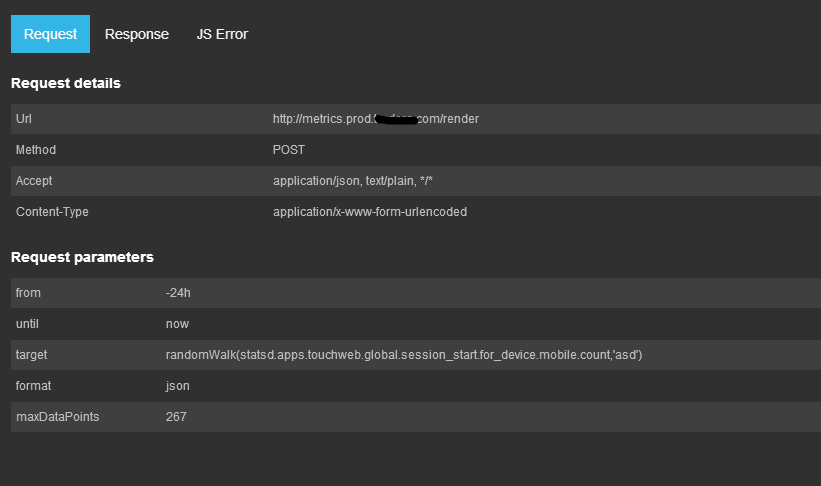
The inspector has two tabs, one with request details and one with the full error response.
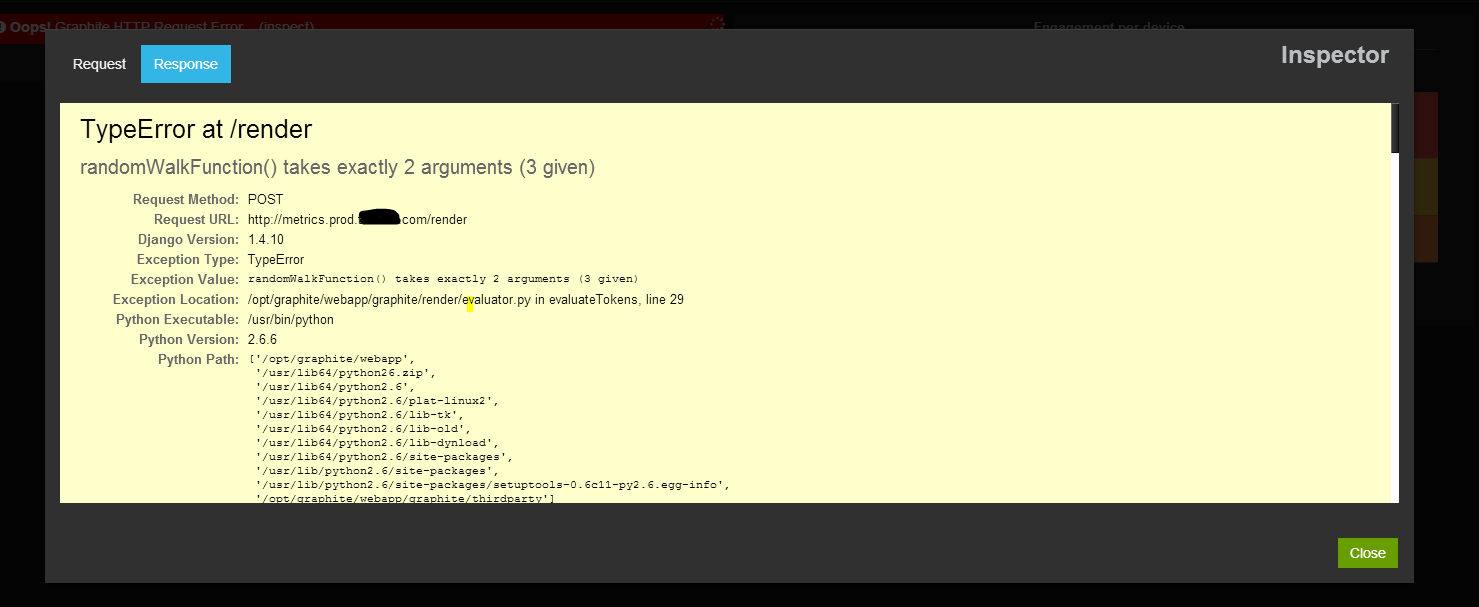
The Response tab shows the full HTTP response from graphite in an iframe. To get descriptive errors like above DEBUG=True must be configured graphite-web’s local_settings.py.
There is more in this relase! Some improvements to InfluxDB support, like using aliases. There is also an improvement to scripted dashboards. You can now write async dashboard scripts that use for example a jquery ajax call to fetch data and create even more dynamic dashboards.
Happy Easter!


