What's new from Grafana Labs
Grafana Labs products, projects, and features can go through multiple release stages before becoming generally available. These stages in the release life cycle can present varying degrees of stability and support. For more information, refer to release life cycle for Grafana Labs.
Loading...
Area of interest:
Cloud availability:
Cloud editions:
Self-managed availability:
Self-managed editions:
No results found. Please adjust your filters or search criteria.
There was an error with your request.
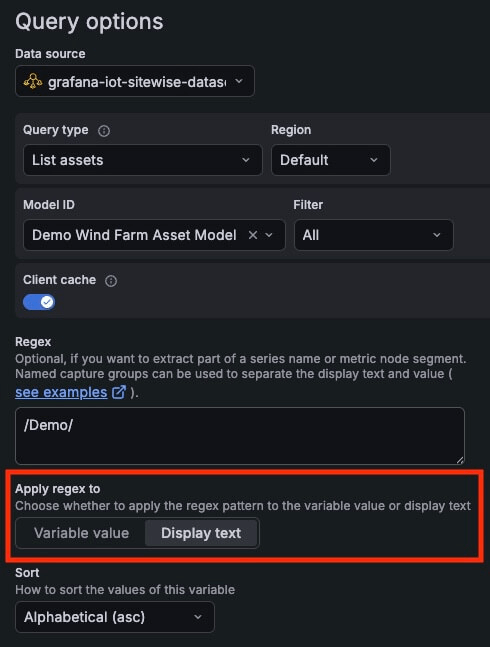
Find the right query variable values to show by applying a regex pattern to the display text instead of the variable value. This is a great shortcut for those times when the text you see in the UI doesn’t match the raw value you need to capture.
Grafana Fleet Management helps you monitor the health of your collectors - at a glance and across a variety of dimensions. With our latest feature, you now have one more way to track collector health. Visual indicators tell you when one of your collectors experiences a remote configuration error and show you where to fix it.
Grafana Fleet Management has introduced an integrated Assistant experience for configuration pipelines. With preconfigured prompts, you can use Assistant to explain, validate, fix, optimize, or visualize your pipelines.

Fine-grained role-based access control (RBAC) has come to Grafana Fleet Management! With the new Collector App Reader role, you can grant read-only access to Fleet Management resources such as collectors, attributes, and configuration pipelines.
Private Source Map Upload is now Generally Available. Grafana Frontend Observability uses source maps to convert stack traces from JavaScript browser errors back into their original representations so that you can see the line of code that cause the issue.
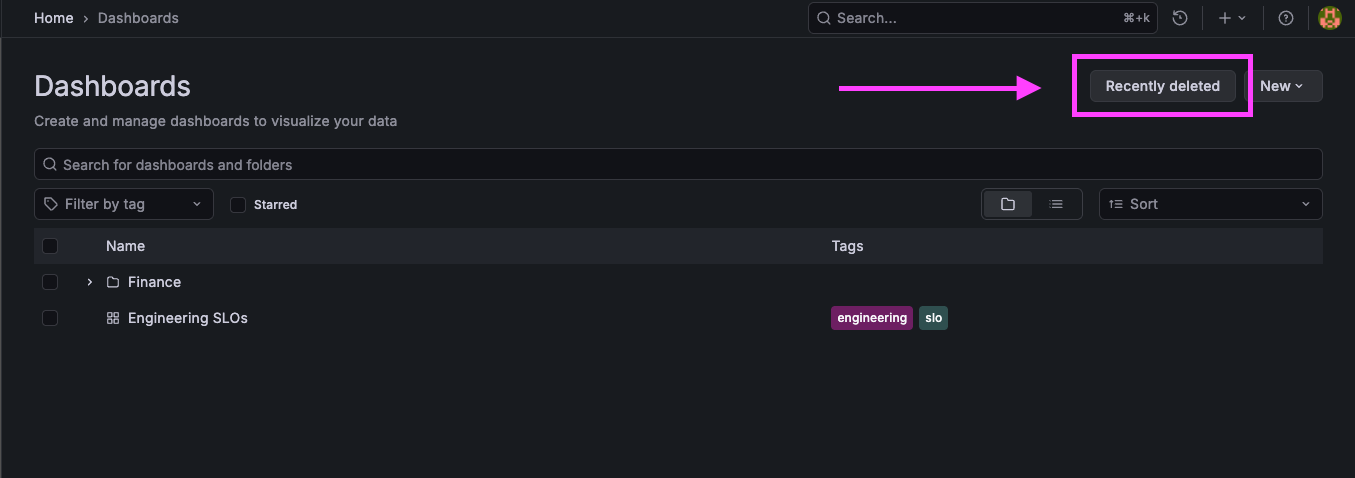
Dashboards can get crowded when you rely on many template variables, annotation controls, and dashboard links. These elements take up valuable space in the toolbar and can make it harder to stay focused on the data that matters. To improve clarity and reduce visual noise, we’re introducing a new dashboard controls menu that keeps your dashboards clean and organized.
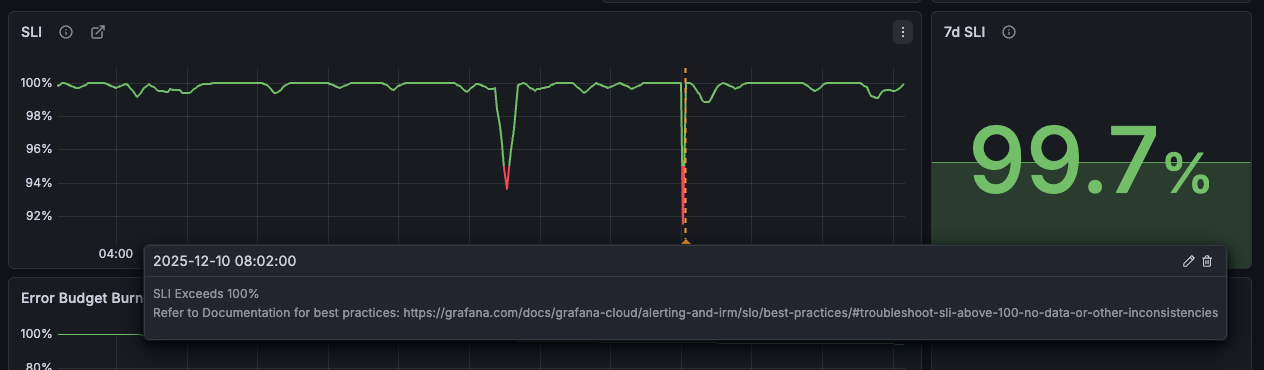
When users see SLI graphs spike above 100%, it can lead to confusion and concerns about whether the SLO or SLO plugin is functioning correctly.
You can now capture and attach screenshots to an incident from anywhere in Grafana. This helps you share visual evidence fast and keep your incident history complete.
Short URLs created when sharing an Explore link or a dashboard internally are now saved indefinitely by default.
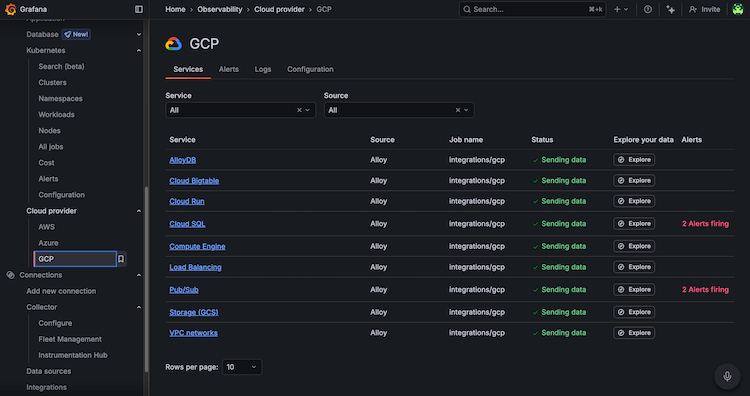
You can now view machine learning predictions for drilldown instances of preconfigured dashboards in Cloud Provider Observability using the Predict button. Predictions help you ensure resources are available during spikes in usage, as well as help you decrease the amount of resources due to over provisioning.
We’re changing how we roll out updates to Grafana Cloud by separating feature enablement from code delivery. As Grafana Cloud expands, we’re in the process of moving to a continuous delivery model so different parts of Grafana Cloud can be updated more frequently and reliably on their own schedule.
We’ve expanded our Cloud Provider Observability offering with new out-of-the-box dashboards designed to give you faster insights and reduce the operational overhead across your multi-cloud infrastructure. These dashboards are now available for key services across Google Cloud, Microsoft Azure, and AWS. Each dashboard is an actionable observability layer, helping your team move from reactive troubleshooting to proactive performance and cost management.
Recently, the Alert rule page received a total redesign. The new Alert rule page features a smoother, faster, and more flexible design to help make your alert rule management easier.
If you’d like to try it out in our private preview, you can sign up here. And we would love your feedback, you can share it here.
The alert rule page has received a total redesign. The new page features a smoother, faster, and more flexible design to help make your alert rule management easier.