
What's new from Grafana Labs
Grafana Labs products, projects, and features can go through multiple release stages before becoming generally available. These stages in the release life cycle can present varying degrees of stability and support. For more information, refer to release life cycle for Grafana Labs.
Loading...
Area of interest:
Cloud availability:
Cloud editions:
Self-managed availability:
Self-managed editions:
No results found. Please adjust your filters or search criteria.
There was an error with your request.
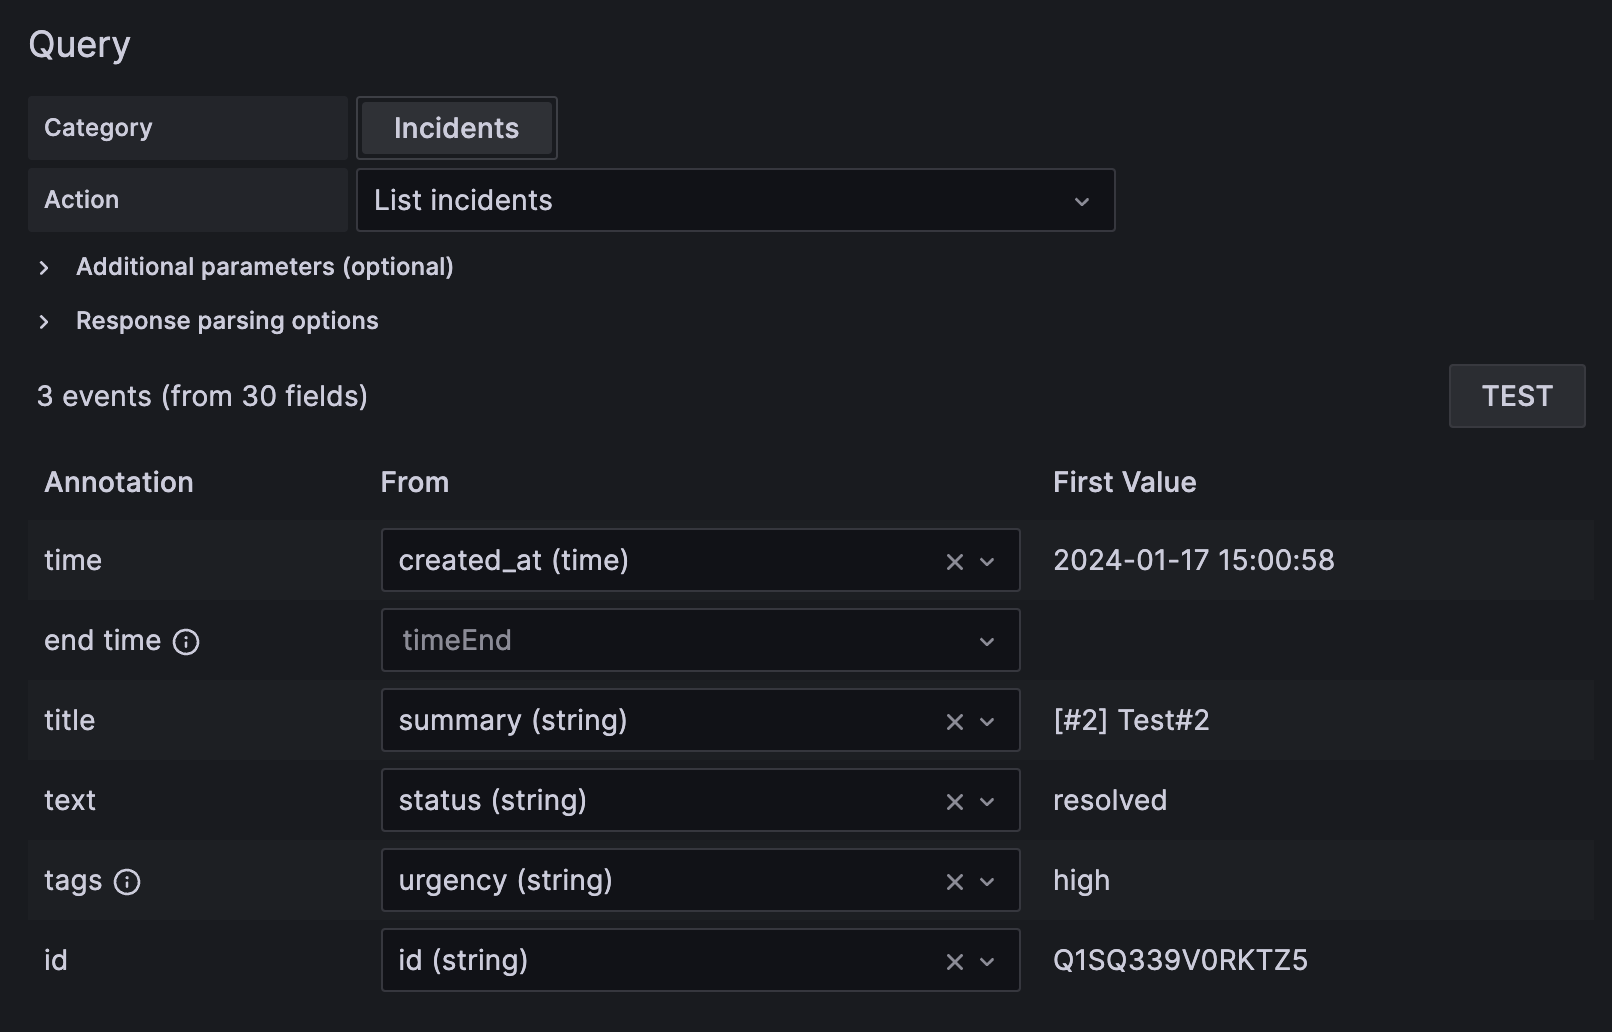
PagerDuty enterprise data source plugin for Grafana allows you to query incidents data or visualize incidents using annotations.
Plugin is currently in a preview phase.
Structured metadata is a feature in Loki and Cloud Logs that allows customers to store metadata that is too high cardinality for log lines, without needing to embed that information in log lines themselves.
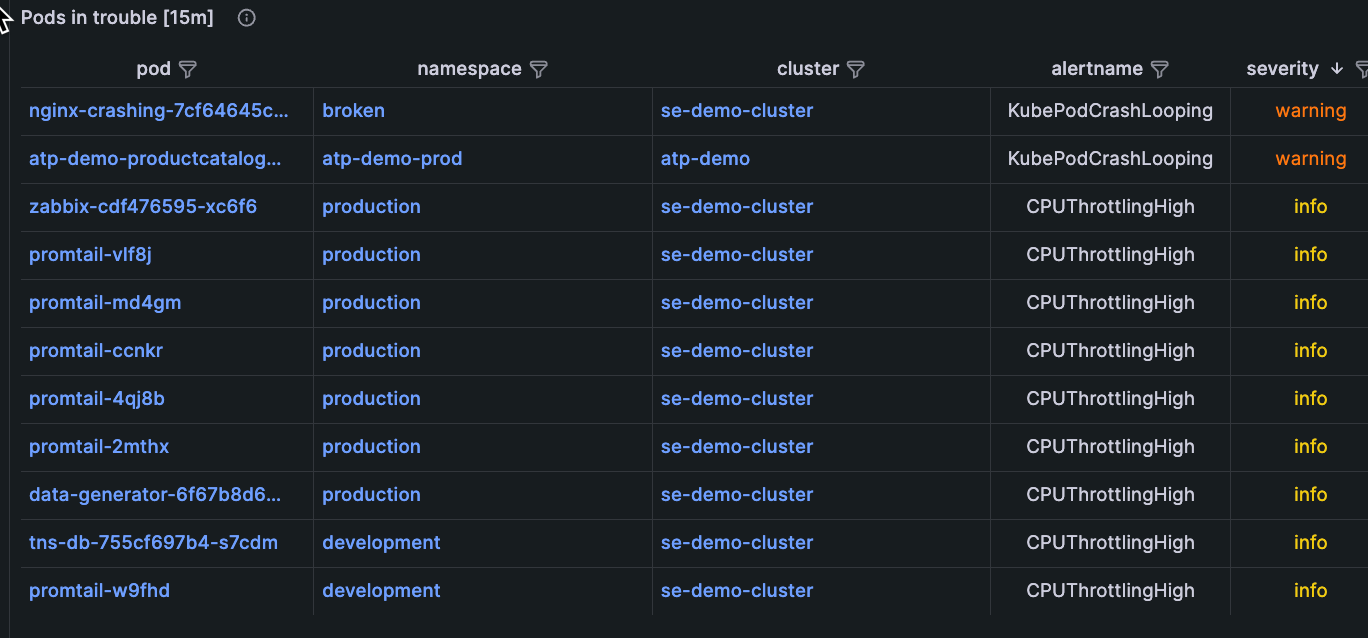
You can respond to and troubleshoot alerts that are firing about your Kubernetes infrastructure and the applications running within it, without leaving the context of Grafana Kubernetes Monitoring. You can start your troubleshooting either through the home page or the Alerts page.
The integration for ClickHouse is available for use with Kubernetes Monitoring.
Release v2.0.0
Explore cost information at any level within your Kubernetes infrastructure. In lists of Clusters, Nodes, namespaces, and workloads, you can switch from a usage view to a cost view to see the cost of each item in the list.
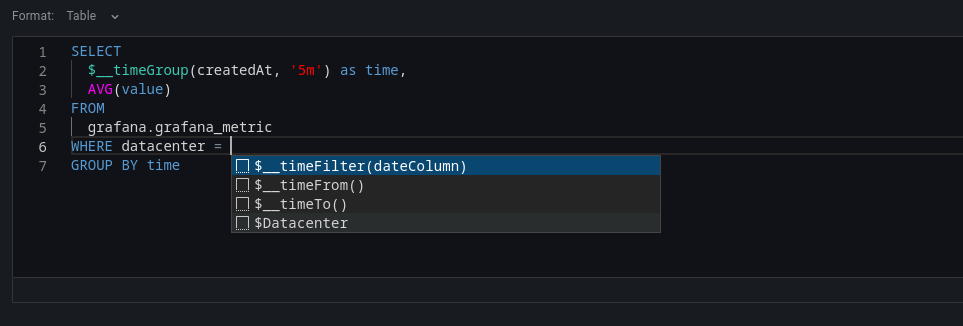
New for the Databricks datasource plugin is the schema aware SQL query builder to help you build faster queries. For general documentation on querying data sources in Grafana, see Query and transform data.
With Kubernetes Monitoring, you can effectively identify, prioritize, and handle efficiency-related issues. Efficiency data is available globally, and your troubleshooting path enables you to create an efficiency feedback loop.

The SLO App generates dashboards to help user pinpoint where they are burning their error budget, in which clusters, for example, by supporting multidimensional SLOs (SLOs that preserve one or more dimensions / label-values). The dashboards that help identify in which dimension the SLI is underperforming were previously only available for ratio-type SLOs or SLO expressions that were fairly simple.
Using Static IPs with k6 allows you to know which IP addresses will be used by the cloud instances generating load during your test runs. This allows you to whitelist these IP addresses only. Knowing the IP addresses that are used can make it easier to identify logs and traffic created specifically by the k6 load tests.
Administrators are now able to directly install, update and uninstall plugins from within Grafana itself, removing the need to switch context and navigate to Grafana.com. This makes it easier than ever to manage plugins in your Grafana Cloud instance and reduces the risk of attempting to install plugins which are incompatible with your Grafana configuration.
When you’re browsing Grafana - for example, exploring the dashboard and metrics related to an alert - it’s easy to end up far from where you started and hard get back to where you came from. The ‘Return to previous’ button is an easy way to go back to the previous context, like the alert rule that kicked off your exploration. This first release works for Alerts, and we plan to expand to other apps and features in Grafana in future releases to make it easier to navigate around.
Copying and pasting time range in the time range picker is now available. For example, you can copy a time range in Explore and paste it into Dashboards and vice versa. You can also copy and paste a time range using the new keyboard shortcuts t+c and t+v, respectively.
The Opsgenie contact point has been extended to allow users to optionally fill out responder information for their integration. Responders tell Opsgenie who an alert should notify according to their escalation policies and routing rules.
InfluxDB introduced a new version, 3.0, in April. With this new version, InfluxDB has put Flux in maintenance mode. But with the new version we have a new querying language, Native SQL. With v10.3.0, Grafana has built-in support for SQL query language in InfluxDB.