What's new from Grafana Labs
Grafana Labs products, projects, and features can go through multiple release stages before becoming generally available. These stages in the release life cycle can present varying degrees of stability and support. For more information, refer to release life cycle for Grafana Labs.
Loading...
Area of interest:
Cloud availability:
Cloud editions:
Self-managed availability:
Self-managed editions:
No results found. Please adjust your filters or search criteria.
There was an error with your request.
When you send Grafana-managed alert email notifications to multiple recipients (without the “Single Email” option), Grafana Cloud Alertmanager now uses BCC instead of TO headers by default. This means individual recipient addresses are not visible to other recipients in the same notification, and the TO field is empty.
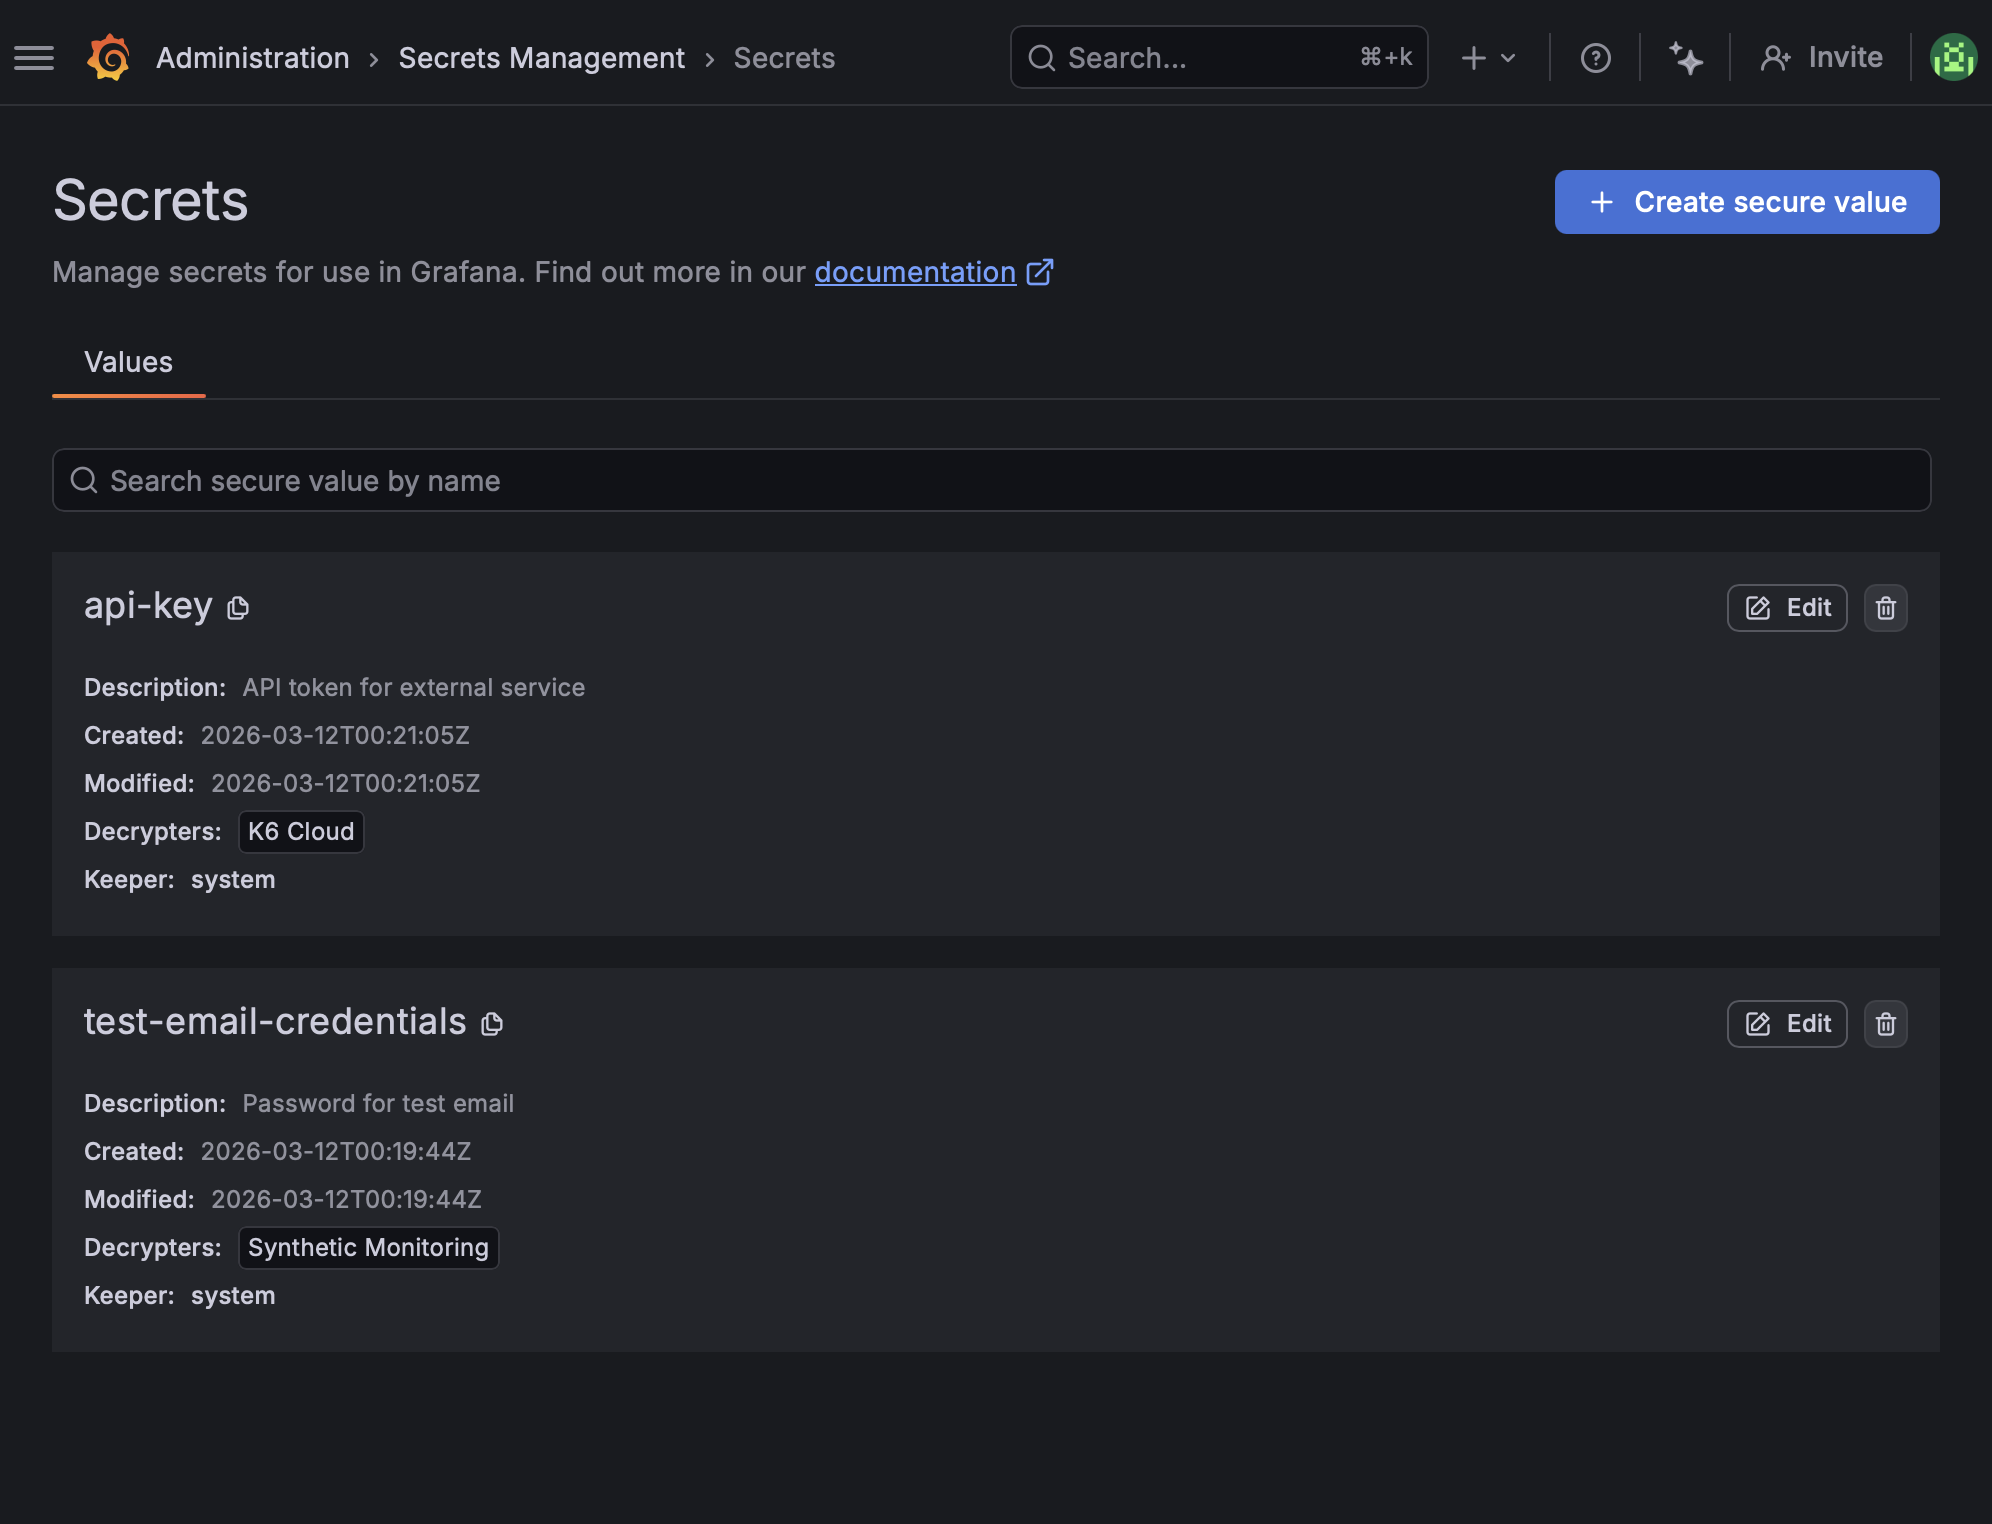
Secrets management launched in Grafana Cloud in August 2025, with integrations in Synthetic Monitoring, and later expanded to Grafana Cloud k6 workflows and Git Sync. Now, we’re introducing a centralized Secrets Management UI that brings secret operations into one place across Grafana solutions.
You can now substitute variables when selecting a saved query without modifying the original query.
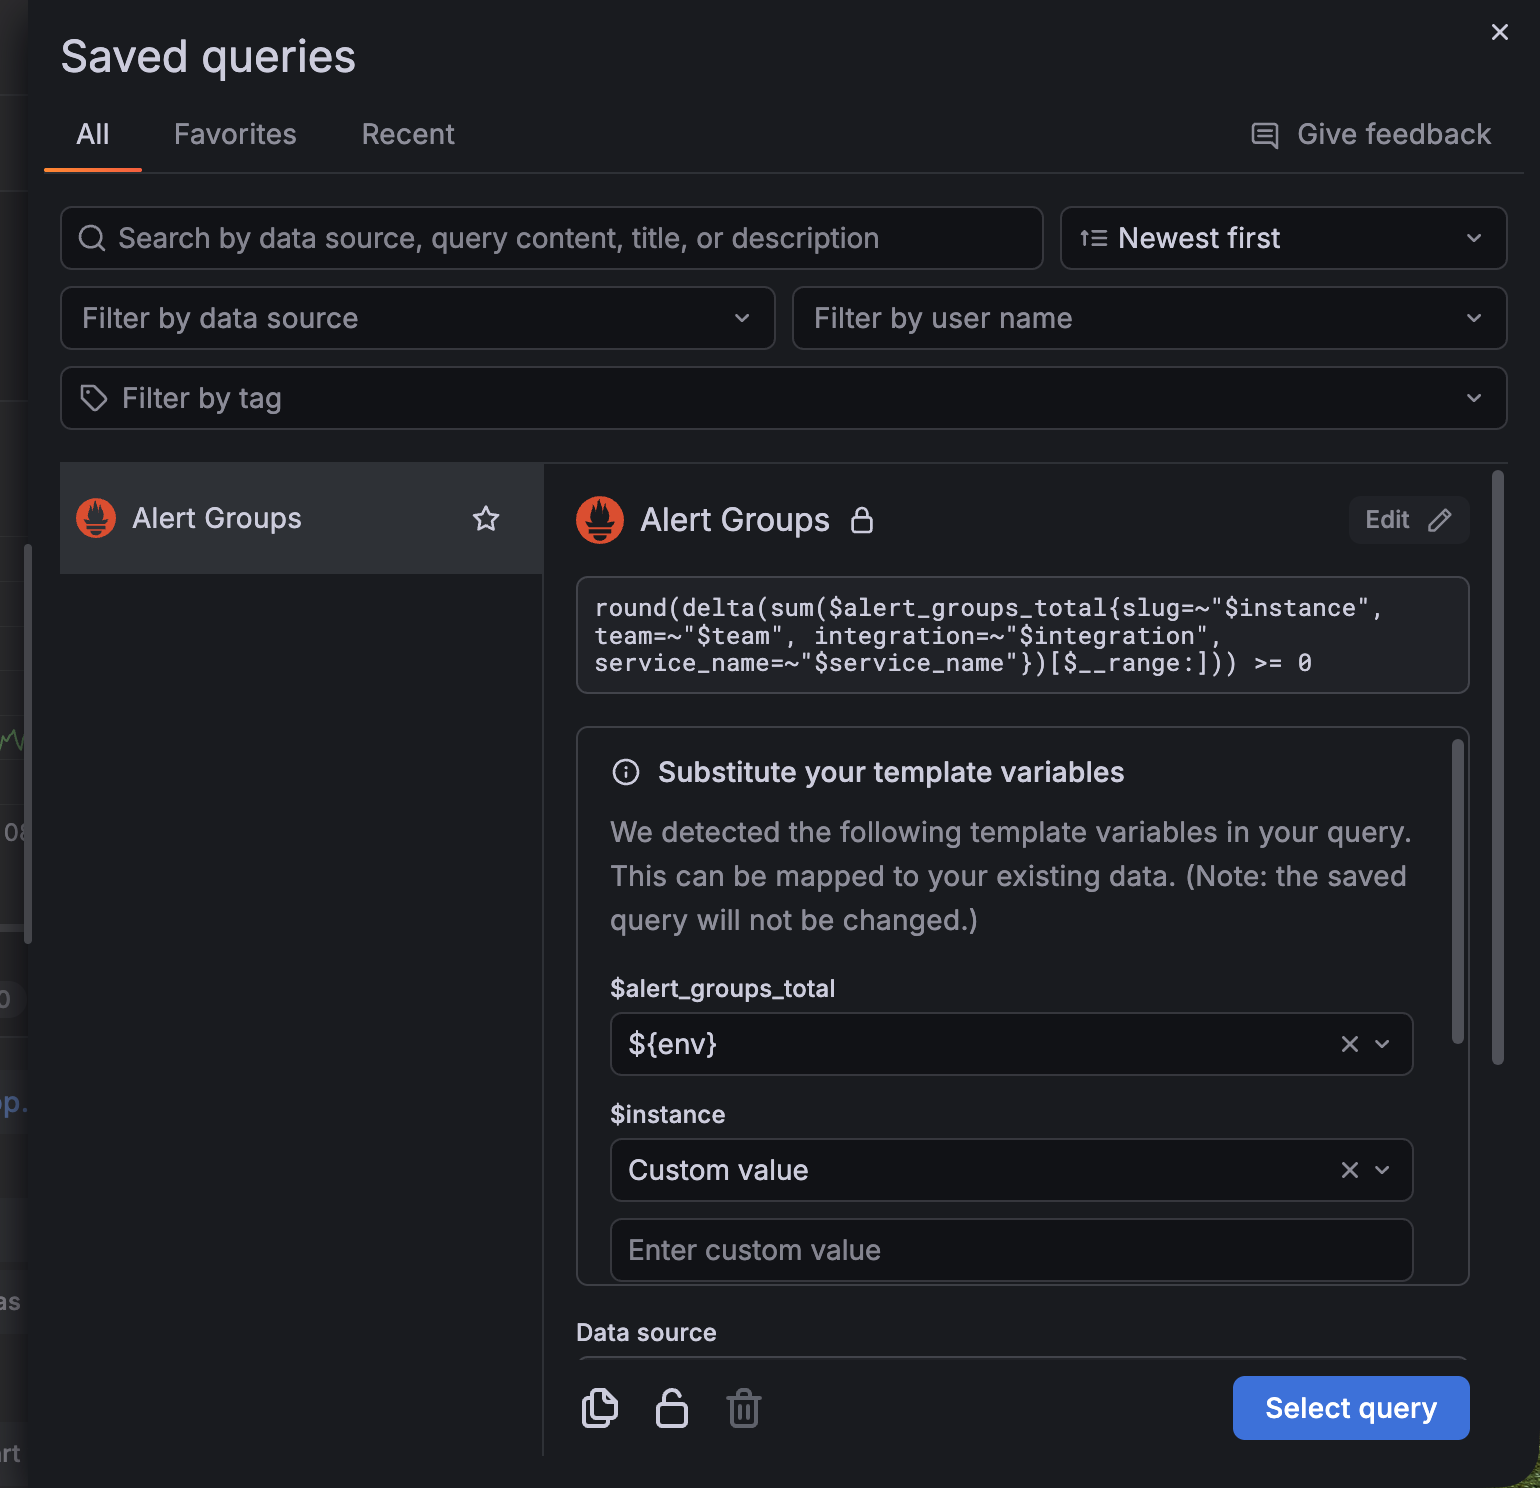
Previously, if a saved query contained variables that weren’t in your dashboard, Grafana displayed a compatibility warning and limited how the query could be reused.
With this update, the warning is replaced with a section where you can update the variable (for example, ${job}) inline by mapping the variable to either:
We’ve removed the legacy plugin that previously served the homepage within Grafana Cloud stacks, cloud-home-app. If you still have links saved that go to <YOUR-STACK>.grafana.net/a/cloud-home-app, update them to go to <YOUR-STACK>.grafana.net instead.
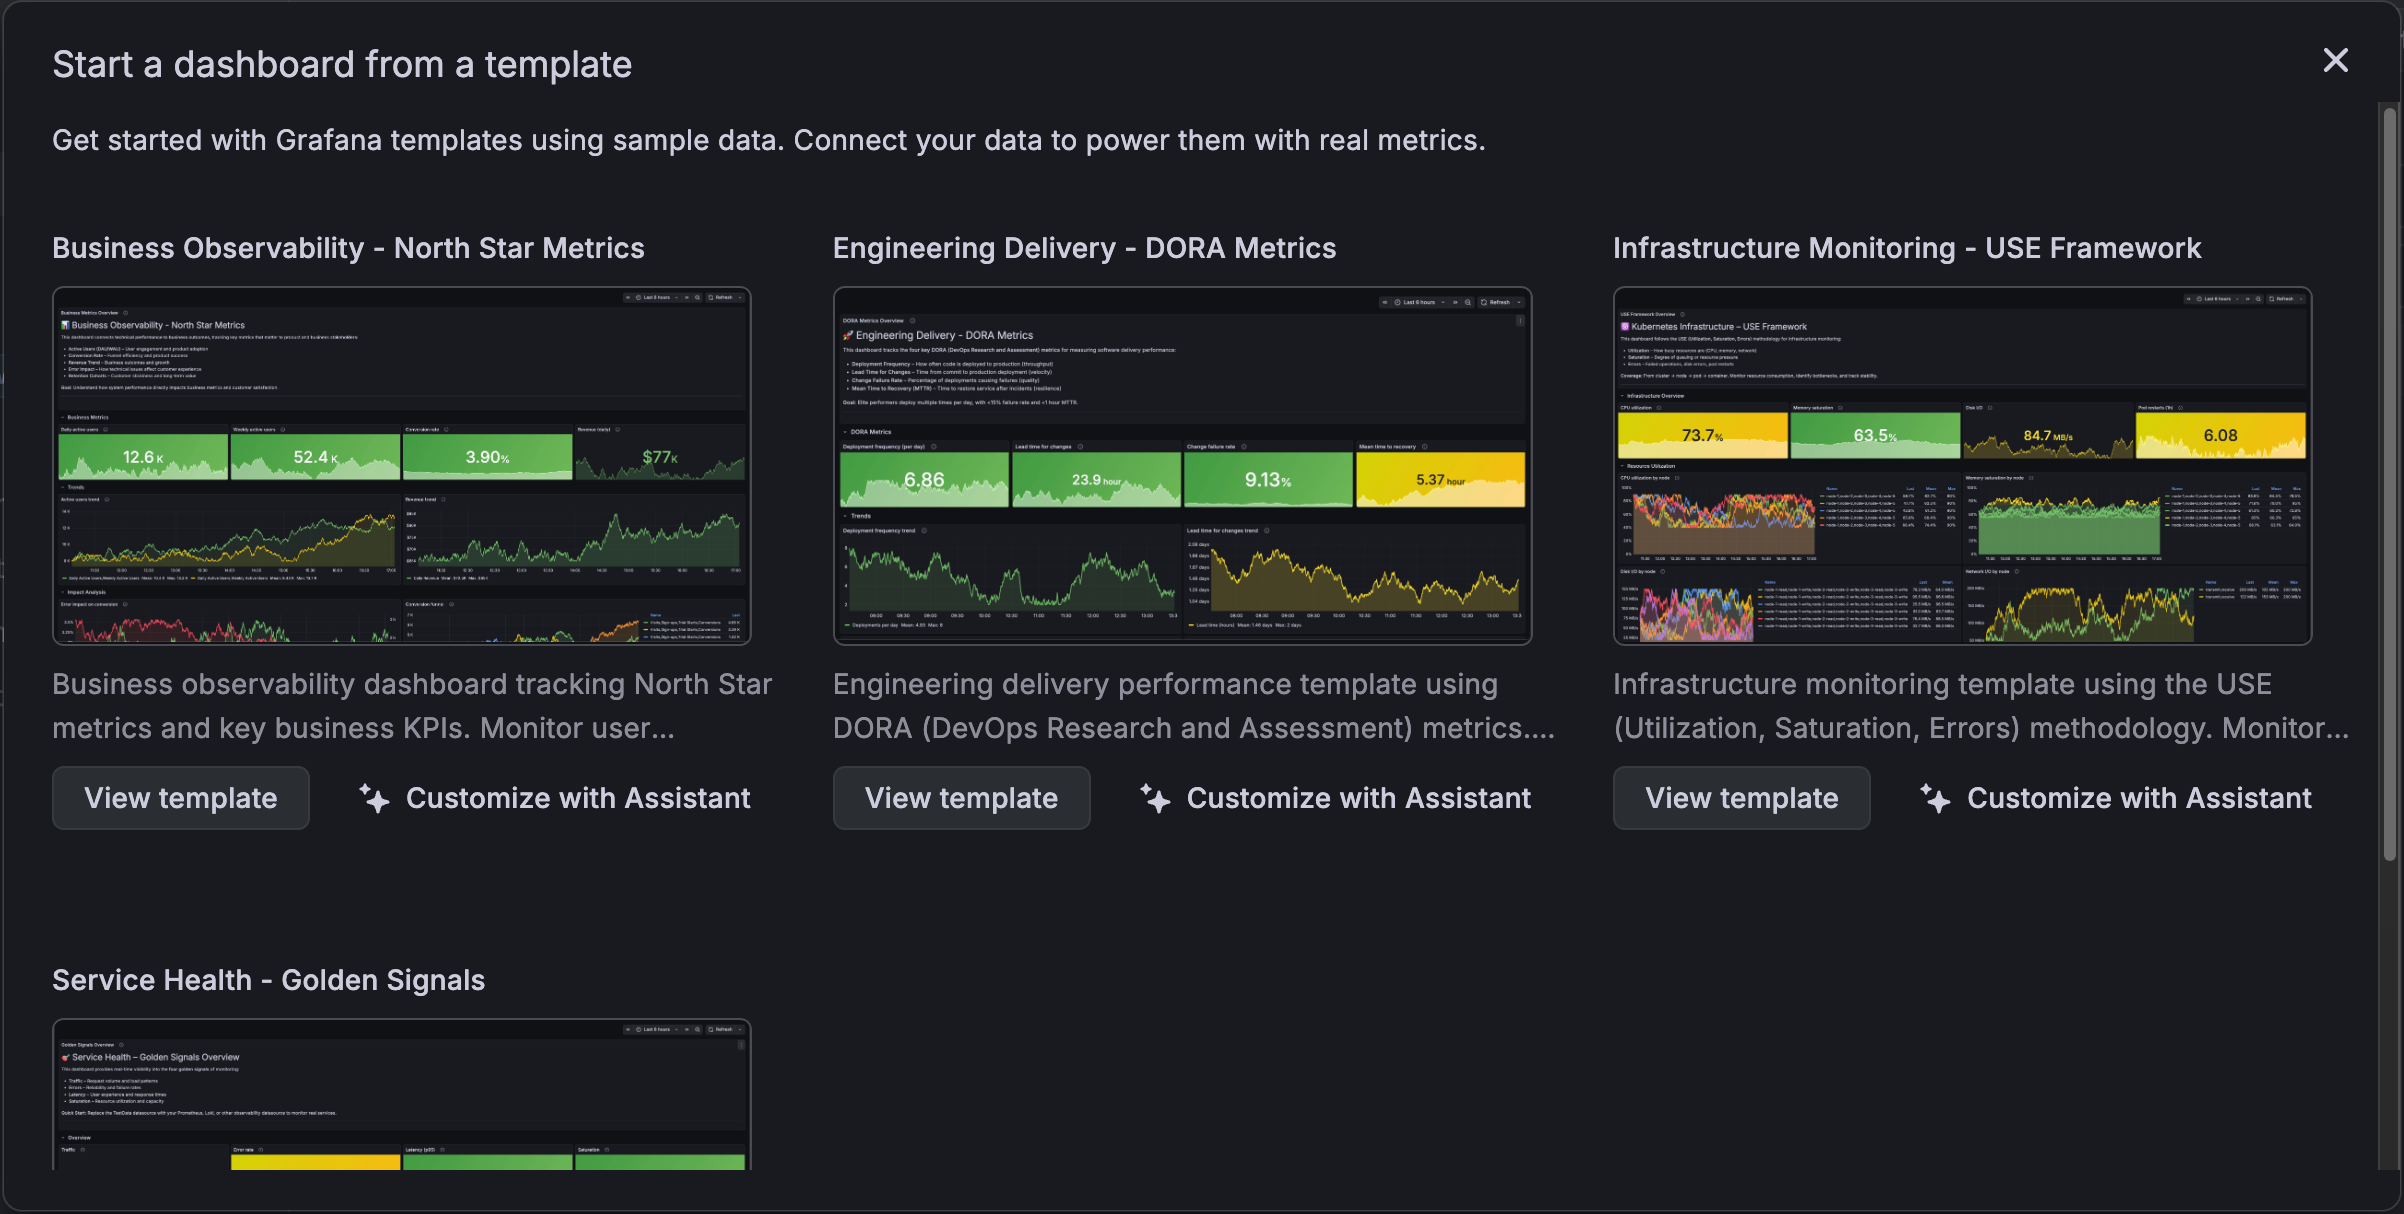
We’ve integrated Grafana Assistant into dashboard templates, so you can now ask the Assistant to help you with the process.
Templates are a powerful way to create dashboards quickly, but they don’t always match your real-world metric names or data sources. The Assistant bridges that gap by:
You asked, we listened.
After announcing the Public preview for Grafana Cloud at the beginning of the month, we are now enabling more functionalities for Git Sync. The top voted feature request was enabling the connection with more providers, and also with self-hosted instances of Git repositories. Today, we are bringing you 3 additional connection types to Grafana Cloud: GitLab, BitBucket and a pure Git integration that adds universal provider support to Git Sync.
You can now create and manage labels from a single location in Grafana Cloud. Label management, available under Alerts and IRM in the Grafana main menu, provides a central view of the labels you use across your alerting, incident response, and operational workflows.
In January 2026, we released the revamped gauge visualization in public preview. This new experience is now generally available. For a full description of the changes, refer to the public preview announcement.
At Grafana, we believe all data deserves visibility. That’s the heart of our Big Tent philosophy. Whether your data comes from cloud-native systems, modern SaaS tools, or long-standing enterprise databases like IBM DB2, it should be easy to explore and visualize in one place. For many organizations, DB2 powers some of their most critical systems. Now, you can bring that data directly into Grafana and see it alongside the rest of your telemetry.
Starting in Grafana v12.4, plugin processes no longer receive all host environment variables by default. This change improves security by limiting plugin access to environment variables from the Grafana host process.
We’re excited to introduce unified storage for playlists in self-managed Grafana!
When Grafana v12.4 starts, the migration system automatically transfers your playlists from the legacy SQL database to unified storage and validates data integrity after the migration completes.
If your instance is small, Grafana now automatically migrates your folders and dashboards to Unified Storage. While this migration won’t have any visible change in the system, it will prepare you for upcoming storage improvements with zero configuration required.
Easily manage Adaptive Logs on a per-team basis.
Seegmentation to granularly manage Adaptive Logs is now Generally Available. Viewing recommendations, bulk editing, and understand savings impact are now all streamlined into a single-segment specific view. SRE’s can feel more comfortable optimizing safely within team boundaries, and balancing the optimization load with their application teams.
Debugging frontend errors just got easier. From the Errors drawer in Grafana Cloud Frontend Observability, click the Analyze button to kick off Grafana Assistant’s root cause analysis investigation.