
What's new from Grafana Labs
Grafana Labs products, projects, and features can go through multiple release stages before becoming generally available. These stages in the release life cycle can present varying degrees of stability and support. For more information, refer to release life cycle for Grafana Labs.
Loading...
Area of interest:
Cloud availability:
Cloud editions:
Self-managed availability:
Self-managed editions:
No results found. Please adjust your filters or search criteria.
There was an error with your request.
We’ve recently announced that Grafana Cloud k6 browser tests are generally available, and now you can export your browser test results as a Grafana dashboard.
Browser testing measures the performance and UX of web applications, including important metrics such as the Core Web Vitals. The exported summary breaks down each metric and explain the impact the performance of your application might have on users. Sharing the summary with your team and other stakeholders can help pinpoint areas that could use optimizations in order to create the best possible user experience.

We have released two new k6 GitHub actions to make it easier to automate your Grafana Cloud k6 performance testing suite and projects.
You can now use the setup-k6-action to install a specific k6 version in your CI/CD workflow. This action provides flexibility when running multiple testing projects and faster execution of testing jobs.
We’ve recently announced that browser tests in Grafana Cloud k6 are generally available, and you can use them to better understand your application’s user experience and fix frontend performance issues. But creating browser test scripts can be a complex task, which is why we’re releasing the k6 DevTools Recorder Chrome extension!

We’d like to announce that we have implemented a preliminary version of folder scoped SLO actions! Now, users that are Folder Editors on a specific folder, can create, update, and delete SLOs associated with those folders. They will continue to be able to view SLOs in other folders, but those SLOs cannot be editable by users who do not have Folder Editor access.
View a history of all alert events generated by your Grafana-managed alert rules from one centralized page. This helps you see patterns in your alerts over time, observe trends, make predictions, and even debug alerts that might be firing too often.
We are delighted to share a new public roadmap for data source plugins being built by Grafana, our partners and our community. All existing and potential users of Grafana can now see our current plans and request new plugins, upvote existing requests, or comment with ideas and requirements.
Role-based access control (RBAC) is now available in Grafana Cloud k6!
With the new Performance Testing roles available in your Grafana Cloud stack, you get fine-grained control over what a User or Team can do in the k6 Performance Testing application, regardless of their Grafana Stack role.
The SSO settings API has been updated to include support for LDAP settings. This feature is experimental behind the feature flag ssoSettingsLDAP.
You will soon be able to configure LDAP from the UI and Terraform.
The SSO settings API has been updated to include support for SAML settings. The UI has also been updated to use the new API instead of the old Settings update at runtime API which is now deprecated and will be removed in a future version of Grafana.
Grafana Cloud k6 Cloud Insights is generally available! Cloud Insights can help you automatically identify potential issues in your system under test or k6 test script and get more accurate and insightful results from your performance tests.
We are excited to release Explore Logs to most of our Cloud customers in public preview!
Explore Logs helps developers quickly troubleshoot and gain insights from logs without needing to run a query.
The Adobe Analytics data source plugin allows you to retrieve reports data from Adobe Analytics.

Standardized tooltips
As a continuation of our efforts to standardize tooltips across visualizations, we’ve updated canvas visualization tooltips to be supported for all elements tied to data. Besides the element name and data, the tooltip now also displays the timestamp. This is a step forward from the previous implementation where tooltips were shown only if data links were configured.
A new home page, Kubernetes Overview, gives you a snapshot of both healthy objects and potential issues.
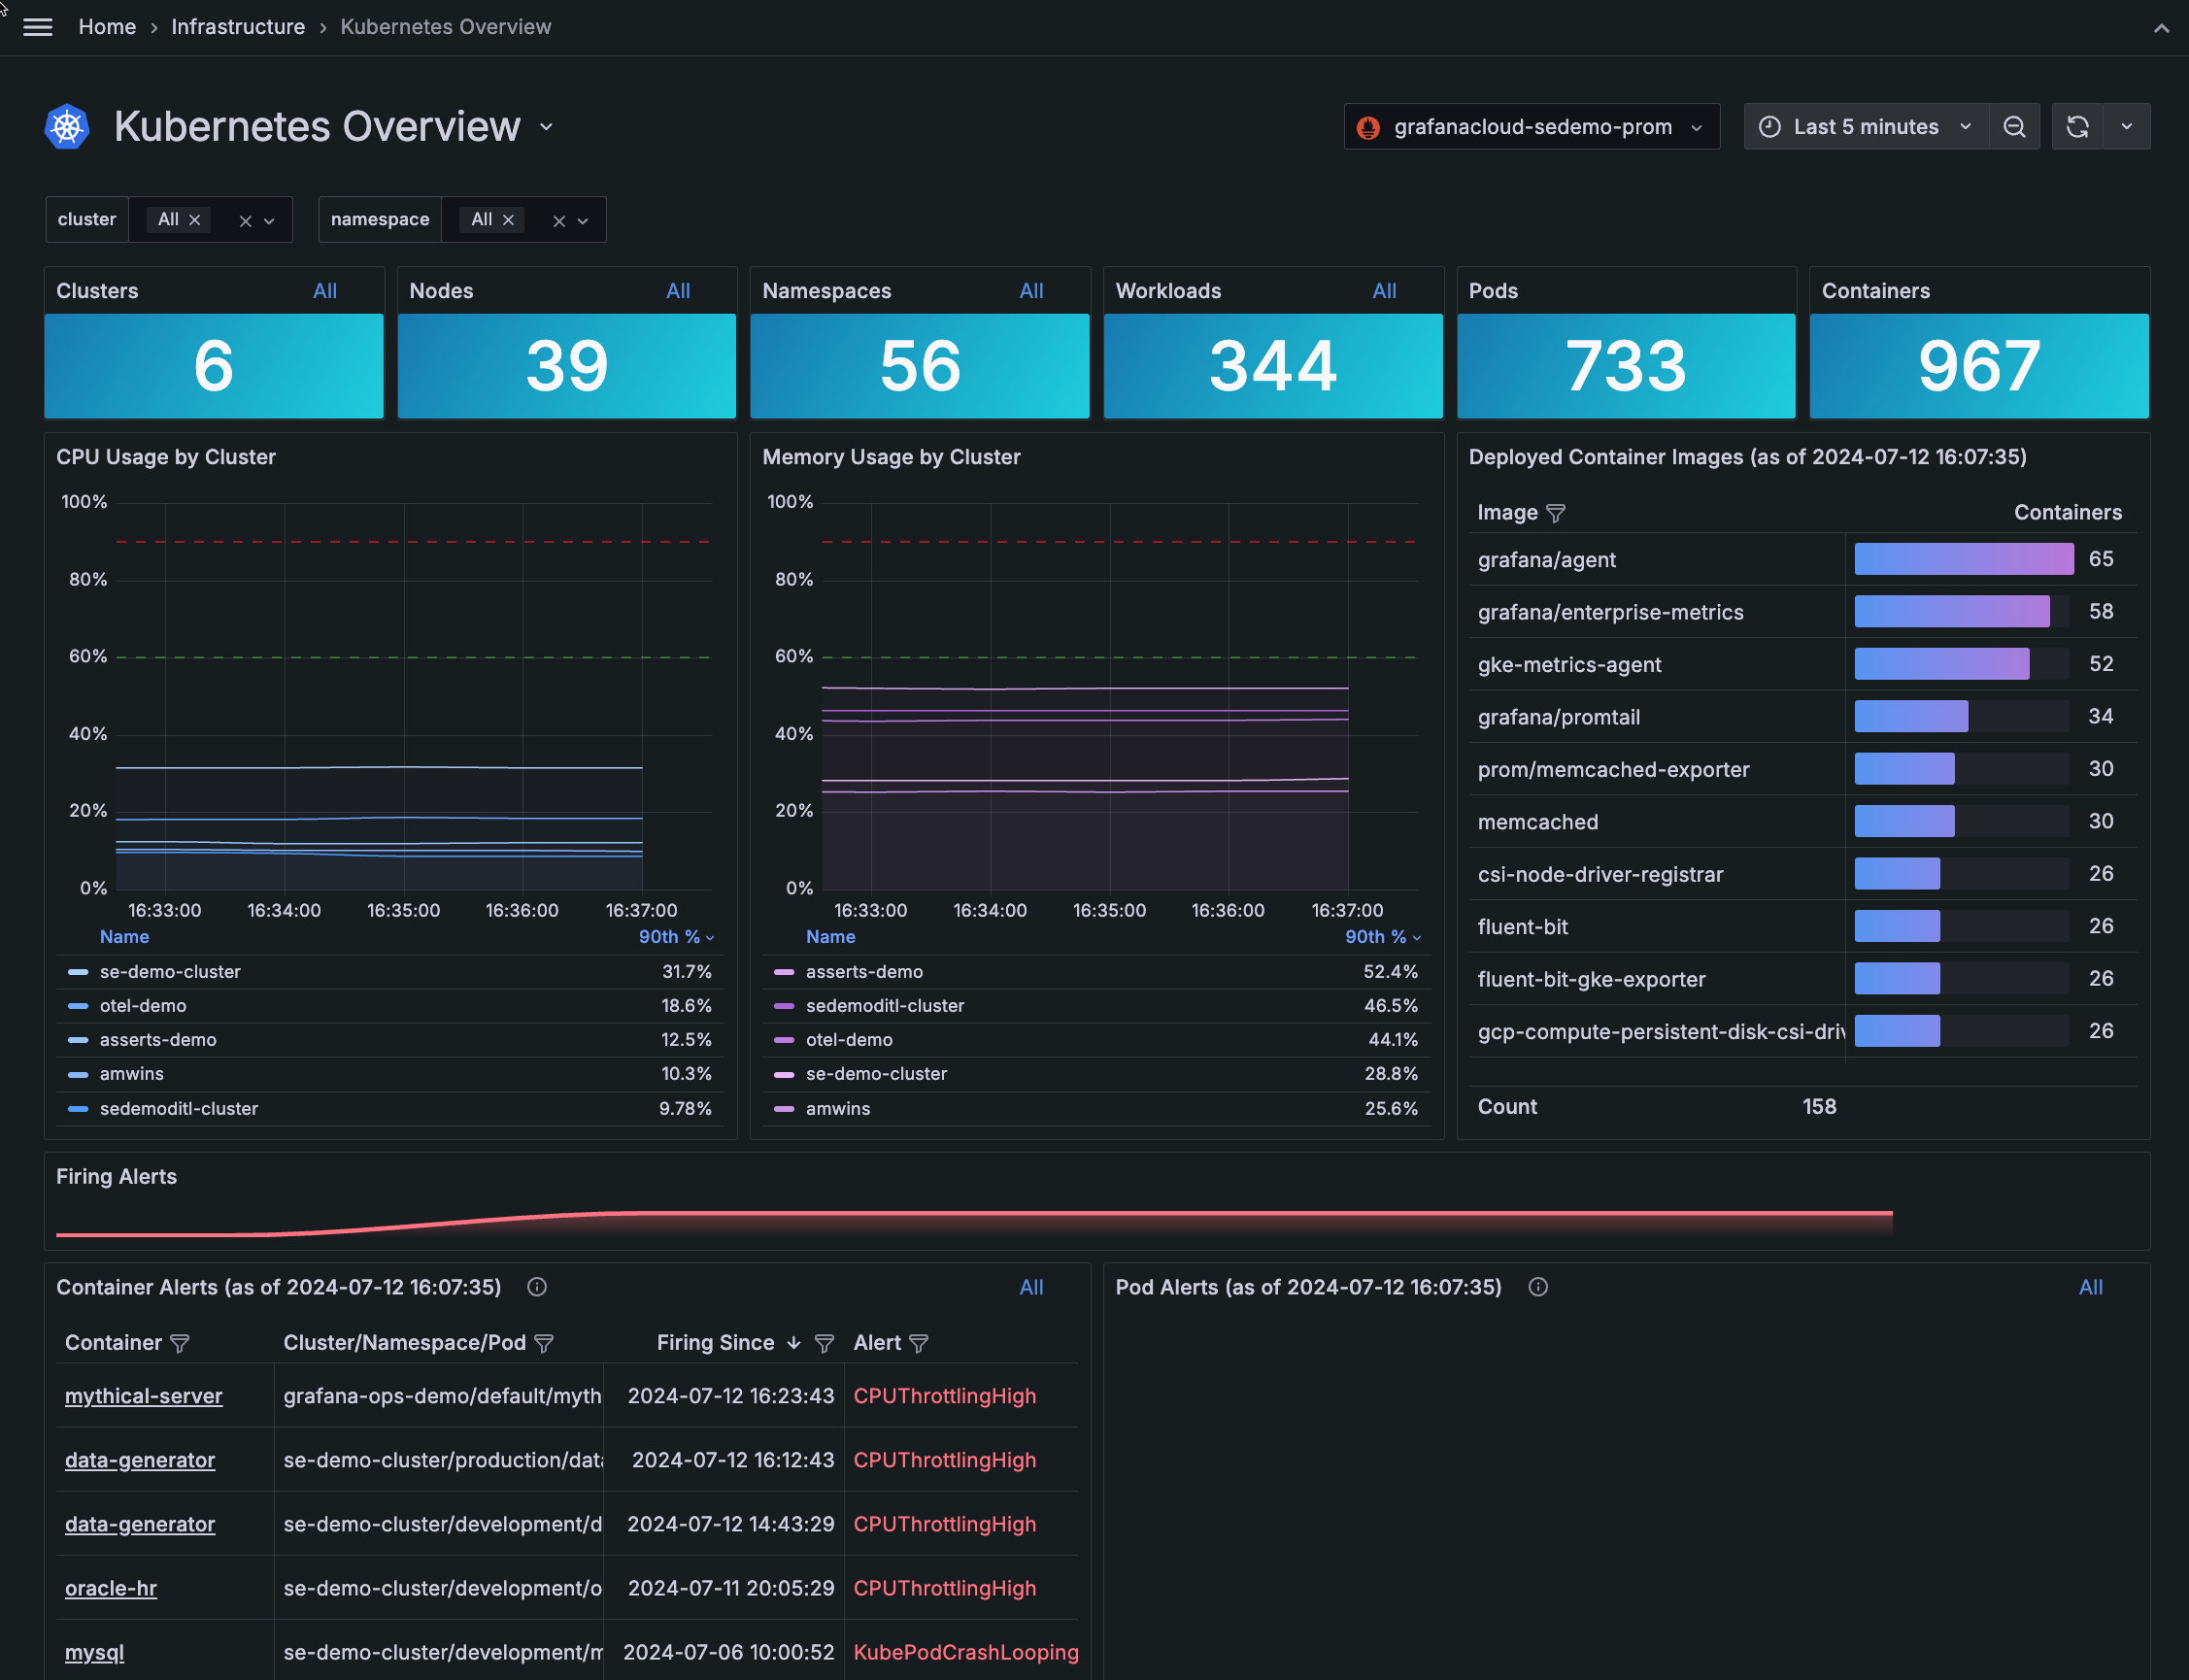
Additional user experience enhancements include:
- Overview and network tabs
- Deep links into Clusters
- More linking into root cause analysis
- Visual indicators for every Kubernetes object, including workload type, Pod, Cluster, and namespace
For more enhanced ways to navigate, refer to Navigation tips.
For the past few months, we’ve been working on stabilizing the k6-browser module and its API, as well as improving the performance of Grafana Cloud k6 in handling browser tests with a high number of VUs.