What's new from Grafana Labs
Grafana Labs products, projects, and features can go through multiple release stages before becoming generally available. These stages in the release life cycle can present varying degrees of stability and support. For more information, refer to release life cycle for Grafana Labs.
Loading...
Area of interest:
Cloud availability:
Cloud editions:
Self-managed availability:
Self-managed editions:
No results found. Please adjust your filters or search criteria.
There was an error with your request.
Between January 13 - 24, we’re launching eight (8) new public probes in AWS: Calgary, Hyderabad, Indonesia, Montreal, Spain, UAE, Stockholm, and Zurich.
The new probes will replace eight (8) deprecated probes running in Linode and Digital Ocean: Atlanta, Amsterdam, Bangalore, Dallas, Newark, New York, Toronto, and San Francisco.
Migrate your Grafana OSS/Enterprise instance to Grafana Cloud in just a few clicks.
The Grafana Cloud Migration Assistant launched in Grafana 11.2 with initial support for dashboards, data sources, and folders. We’re excited to announce support for plugins and Grafana alerts.
The Elasticsearch data source plugin now offers support for Elasticsearch’s Cross-cluster Search feature.
If you’re a big Elasticsearch user, you might have multiple clusters set up for geographical separation, different teams or departments, compliance, or scaling reasons. Previously, you needed to set up a separate data source in Grafana for each cluster. Now with cross-cluster search, you can query data across all these clusters from a single Grafana data source. This makes it simpler and more convenient to query all of your Elasticsearch logs. You can learn more about this feature in the Elasticsearch docs.
We’re excited to introduce service account token authentication for the OnCall API. With this change, you can now generate tokens to interact with the API so that they:
The Grafana Cloud platform and Grafana Cloud k6 application include a broad range of features that can help you maximize the value you get for your testing strategy. But, with several features to learn, sometimes it can take time to figure out where to start.

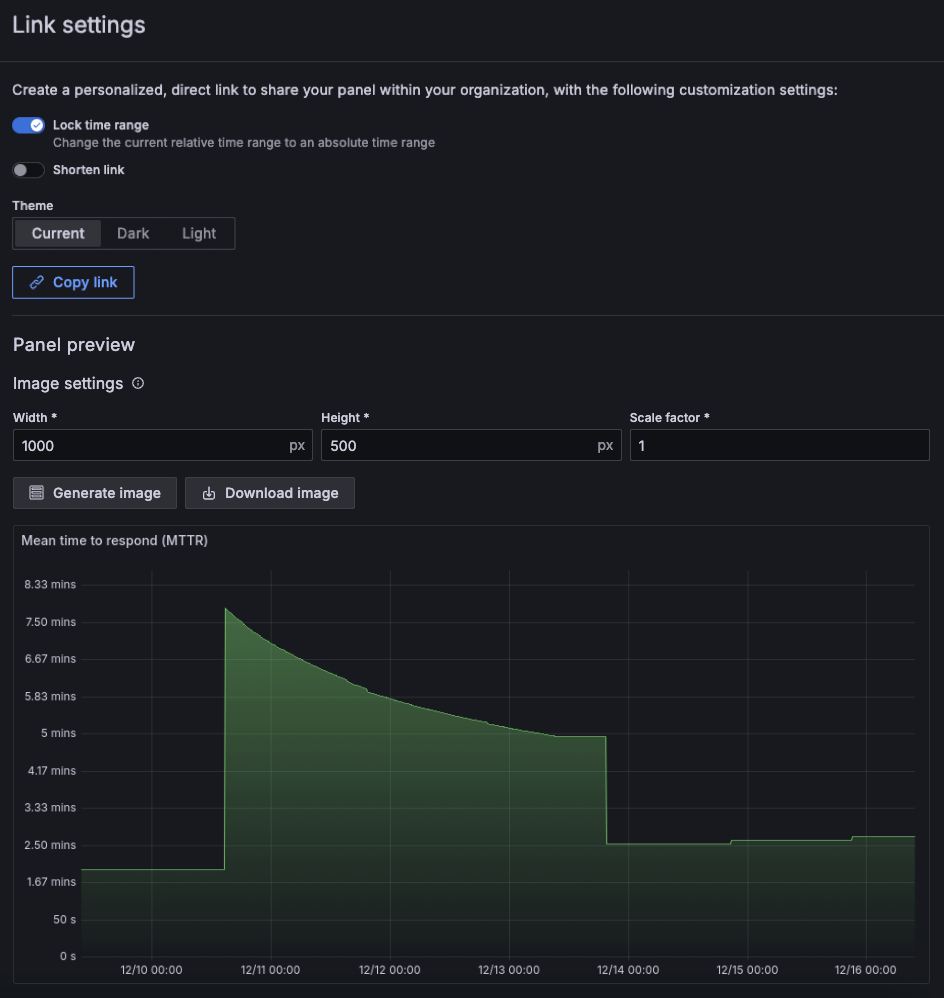
We’ve made some big changes to the panel image sharing experience. When you share a panel link, there’s a new Panel preview section where you can:
We’re excited to announce that a new version of the Grafana Cloud k6 API is now available!
The new Grafana Cloud k6 API includes endpoints that make it easier for teams to integrate k6 with their CI/CD processes. You can:
Grafana-managed alert rules are now supported in Grafana SLO!
Grafana-managed alerting rules gives you access to features like alerting annotations on SLO dashboard panels, SLO alert state history, and images in SLO alert notifications.
Your alerting system can be managed via plugin preferences, and can be set to generate either datasource-managed alert rules, or Grafana-managed alert rules. Check out the documentation for more information.
In October 2024, we announced our redesigned dashboard filters. Now we’re promoting this redesign from public preview to GA.
The redesigned filters are more prominent in the dashboard and filters based on the same ad hoc filter variable are more clearly related. Also, labels can have more than one value using the new multi-select operators. For more information about these changes, refer to the original What’s new entry.
TraceQL queries now use regular expressions that are anchored at both ends. This change makes the queries faster and matches the behavior of PromQL, where regular expressions are also fully anchored.
The Grafana Datadog plugin now includes two new features:
- Percentile Aggregation Function for distribution-type metrics.
- New Query Variable Syntax – now supports all tags associated with a metric.
For more details, check out the video and Grafana Datadog data source documentation.
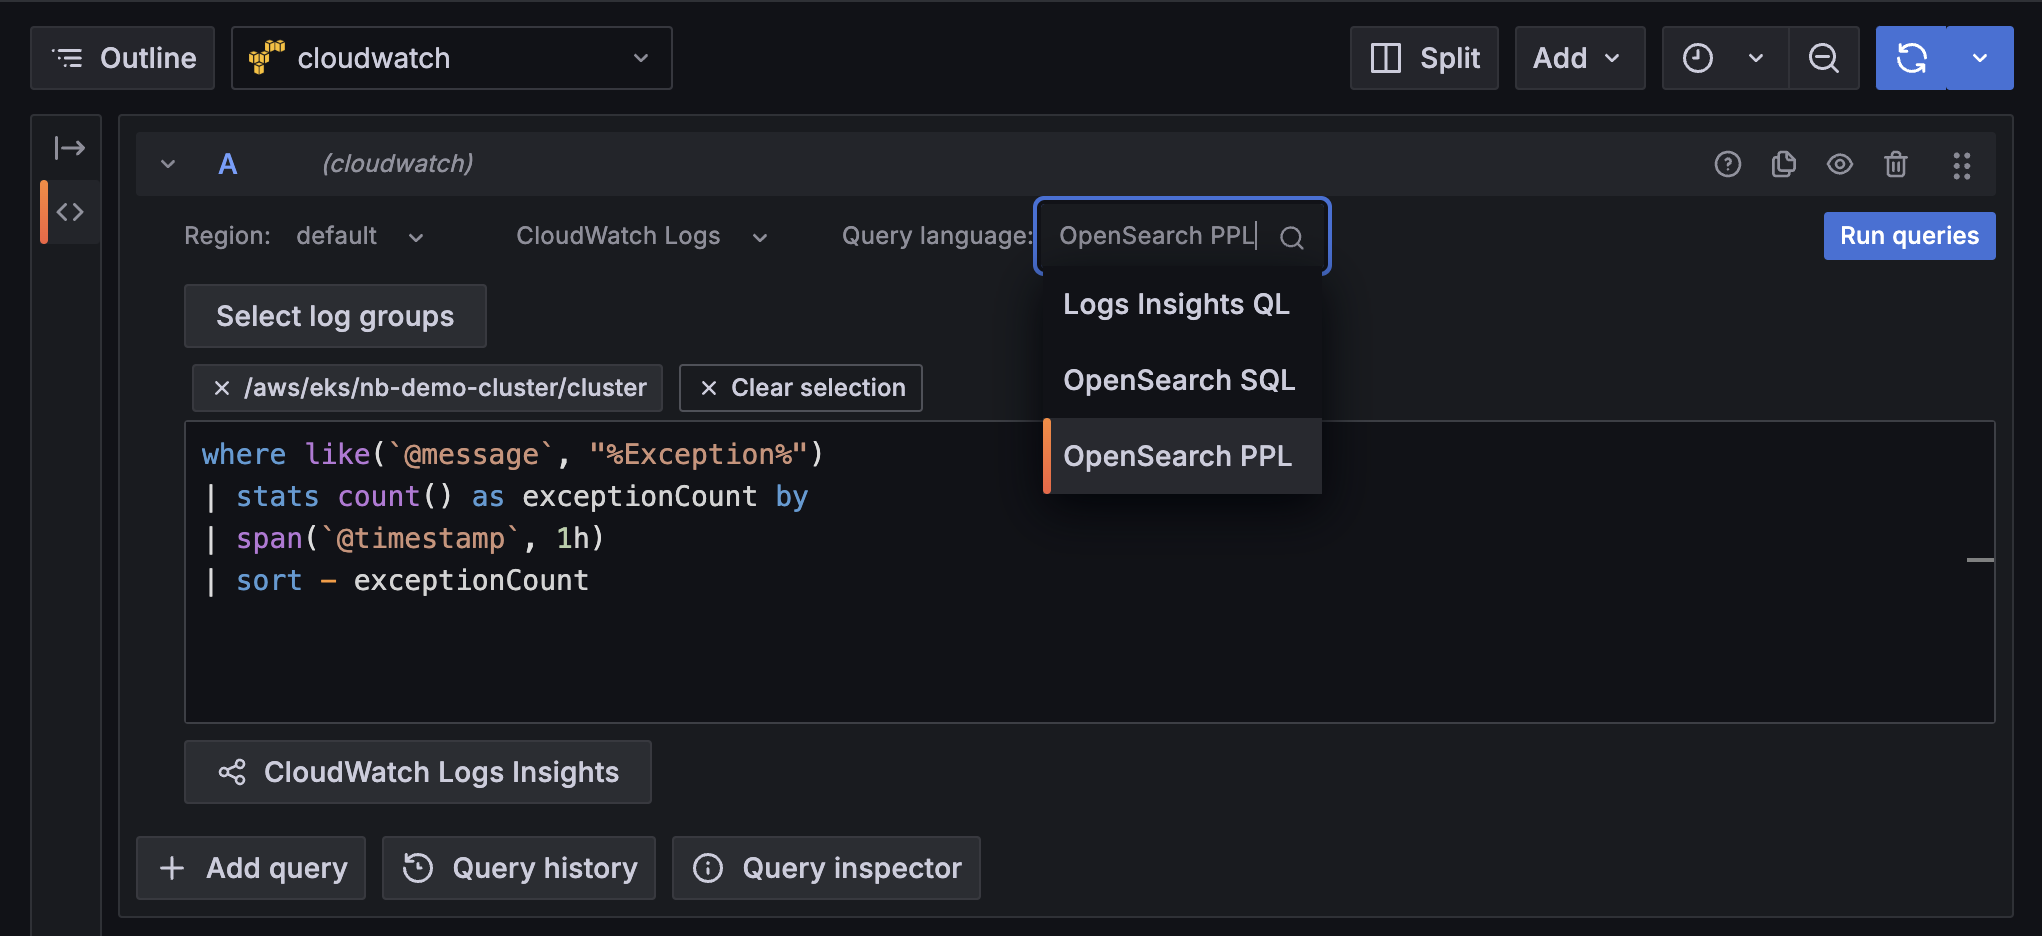
The AWS CloudWatch data source plugin now offers two new query languages for searching through logs: OpenSearch PPL and OpenSearch SQL. You now have increased flexibility to choose a more familiar query language and to take advantage of their unique features (like the SQL JOIN command) when querying AWS CloudWatch Logs Insights. In addition to the already supported Logs Insights QL option, you can find the added query language options in the new Query language drop-down list.
In May 2024, we announced a new way of generating PDFs that introduced a major performance improvement for the PDF export feature. It also fixed all caveats related to rendering a report with panels or rows set to repeat by a variable, like rendering repeating panels inside collapsed rows.
Many teams struggle with picking SLO targets, particularly for new SLOs. The target percentage drives the sensitivity of the burn rate calculations, the error budget remaining, and it can tune alert volume. If you assume you want to create an SLO to ensure “99.5% of HTTP requests return successfully in under 500 ms”, how do you know that 99.5% is a realistic target for your service? People often guess or take a number from management.
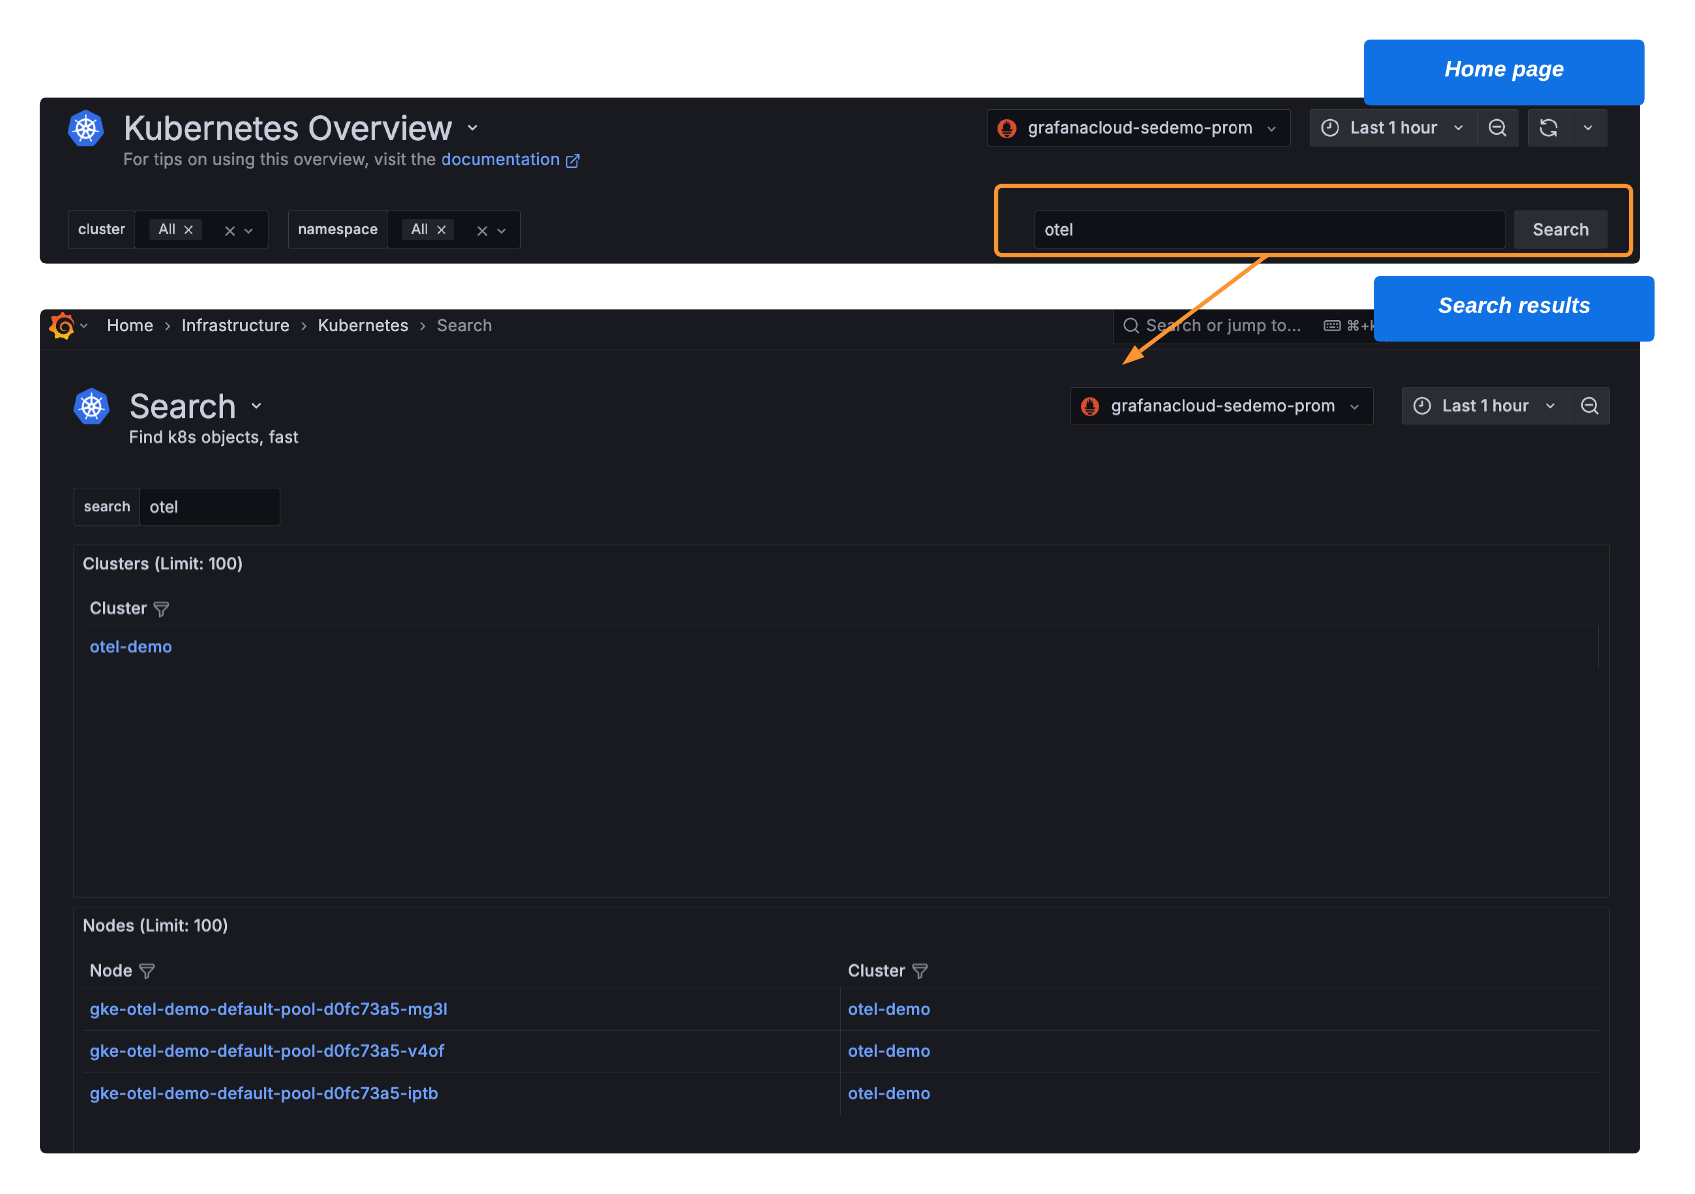
Use Search to find any Kubernetes object in your fleet.