What's new from Grafana Labs
Grafana Labs products, projects, and features can go through multiple release stages before becoming generally available. These stages in the release life cycle can present varying degrees of stability and support. For more information, refer to release life cycle for Grafana Labs.
Loading...
Area of interest:
Cloud availability:
Cloud editions:
Self-managed availability:
Self-managed editions:
No results found. Please adjust your filters or search criteria.
There was an error with your request.
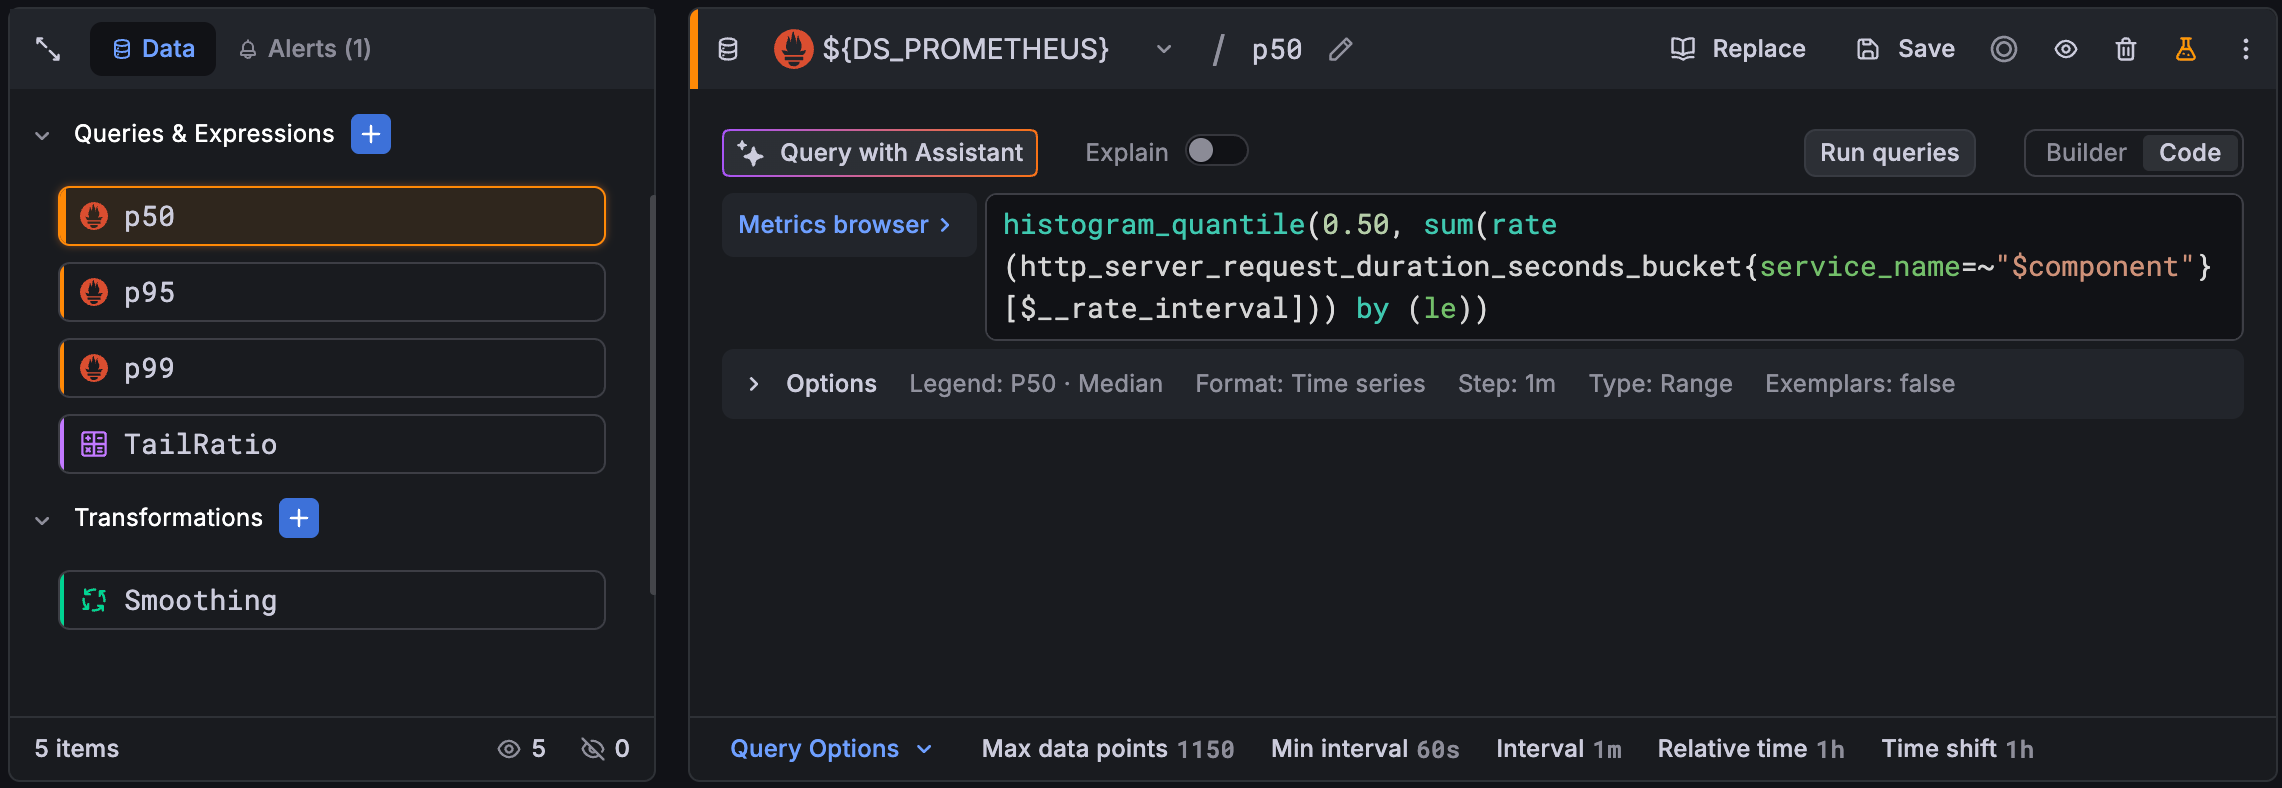
We’ve redesigned the query editor to make complex panels easier to build and manage. The new experience provides a unified view of your entire data pipeline—queries, expressions, transformations, and related alerts—with clearer visual feedback and faster access to the settings that matter.
The GET /api/alertmanager/grafana/api/v2/status endpoint previously required the legacy alert.notifications:read permission. It now requires a dedicated alert.notifications.system-status:read permission. This new permission is included in the fixed:alerting.notifications:writer role, which is granted to Admin users by default.
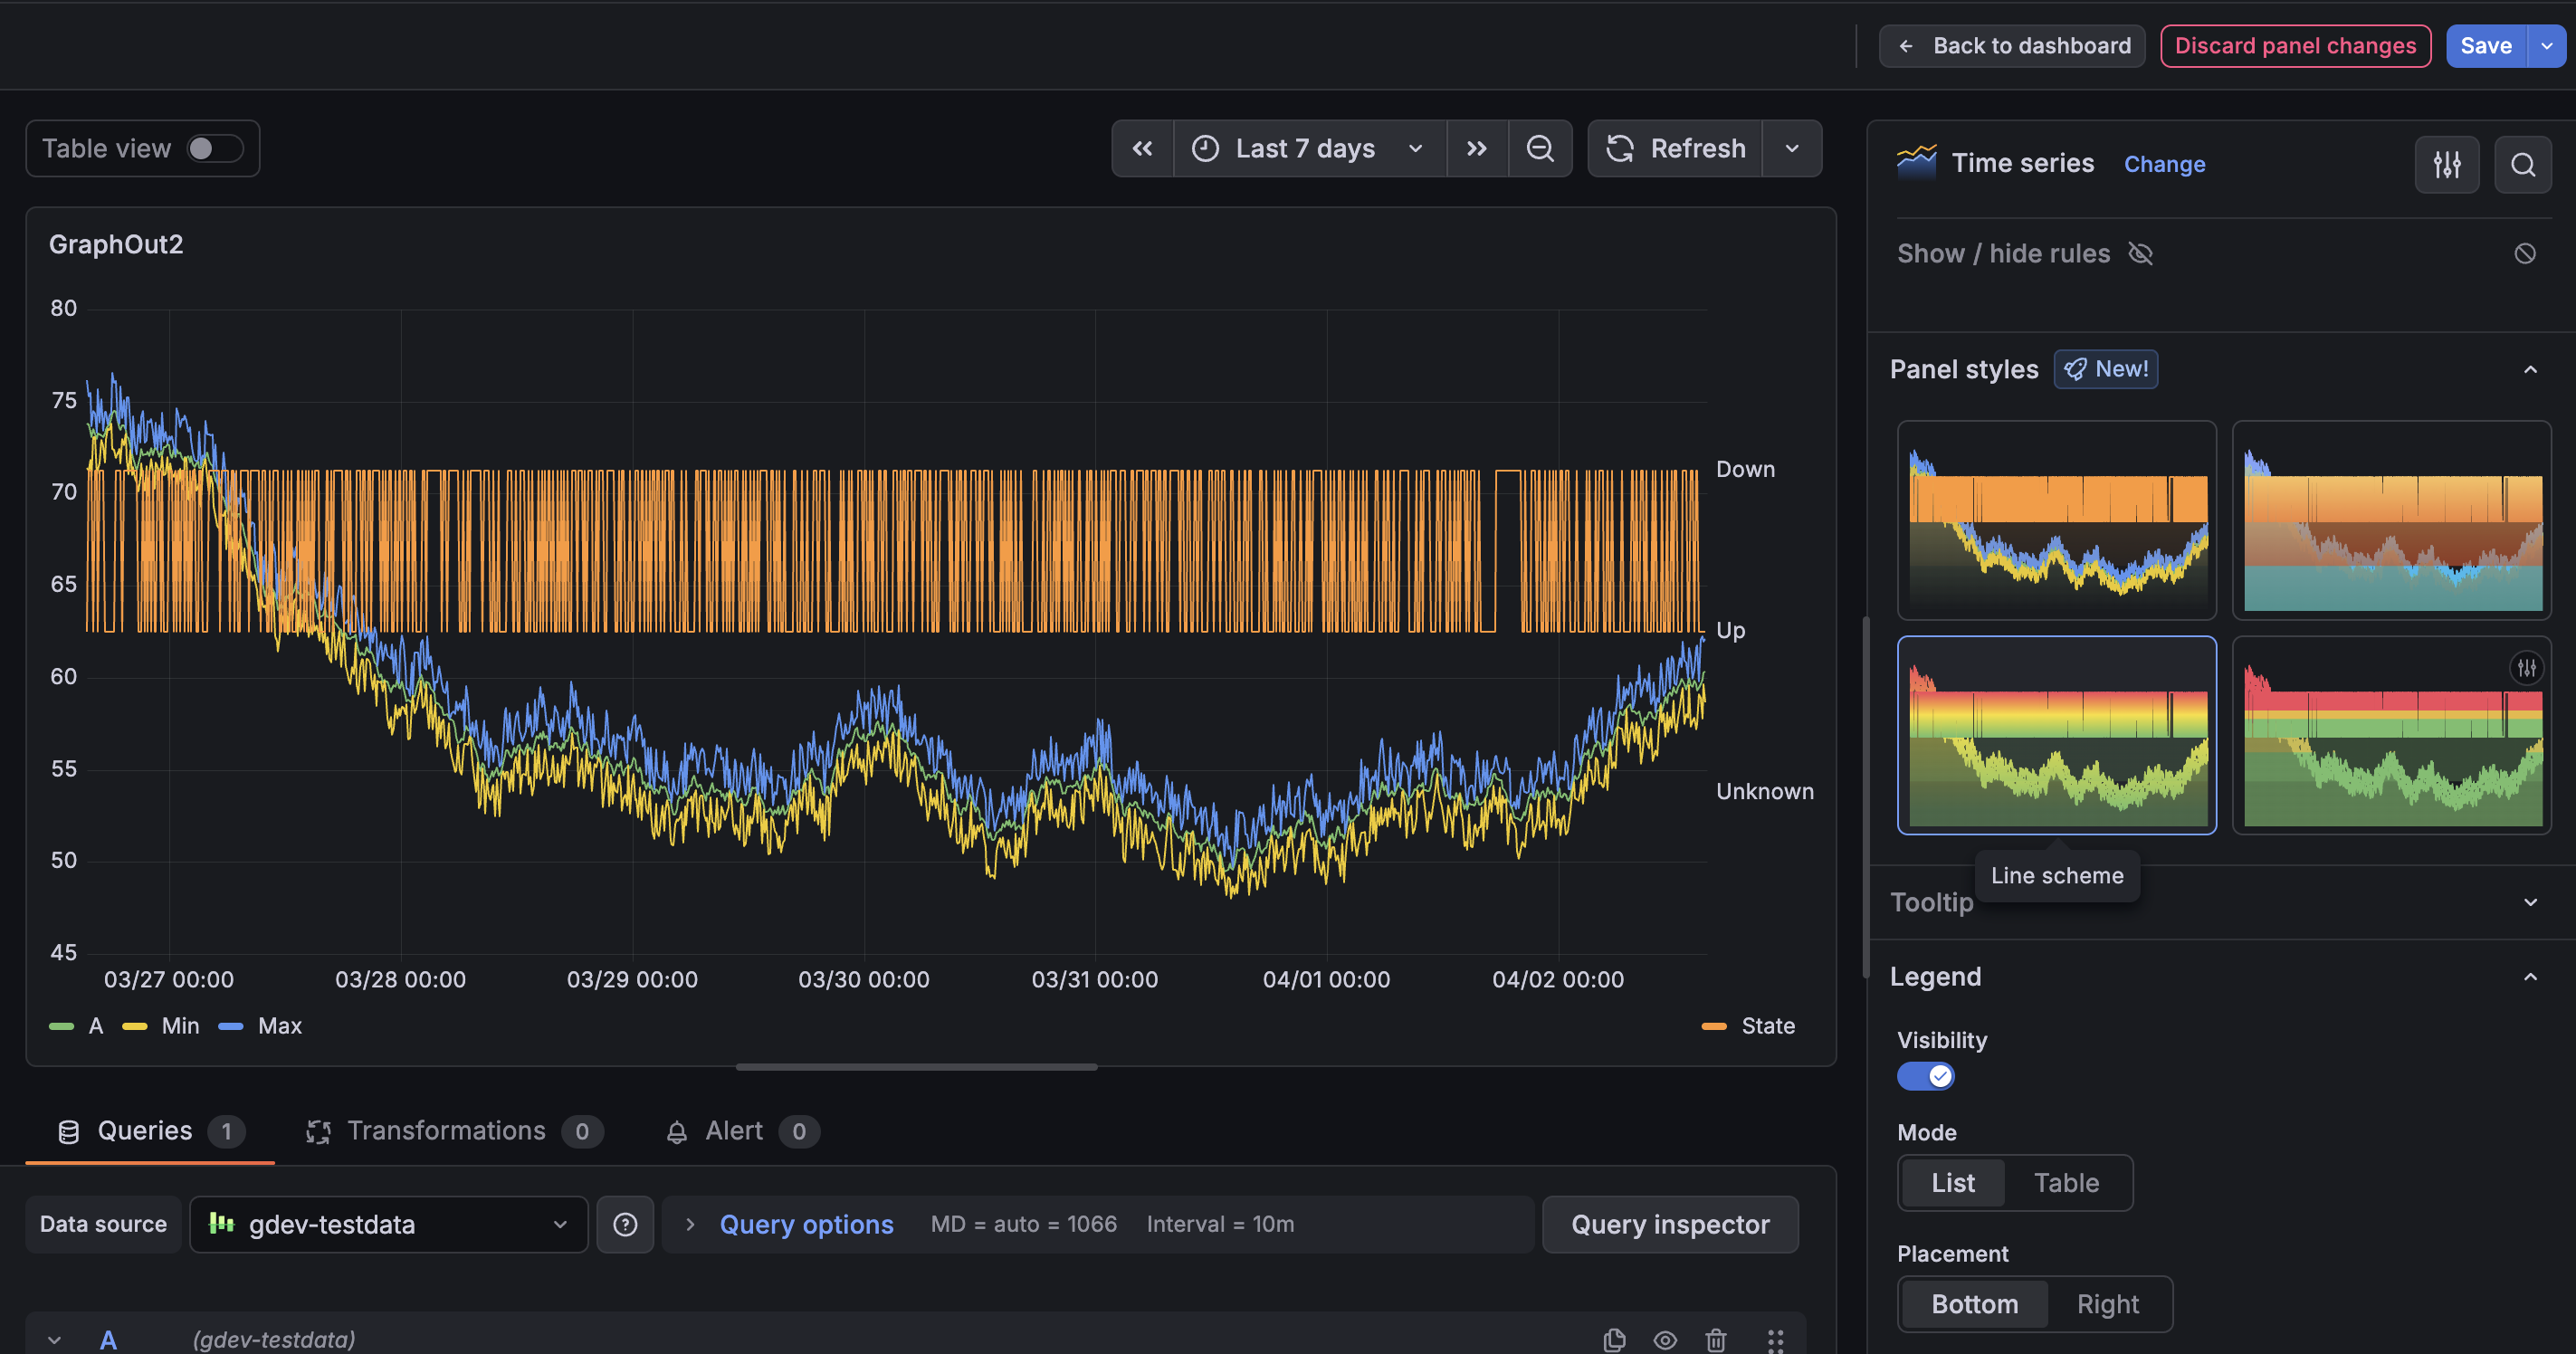
You can now apply Panel styles to quickly update your panels without adjusting multiple options manually. Panel styles provide a curated set of configurations—such as colors, thresholds and display options—so you can quickly get to a more polished visualization with a single click. Panel styles are currently supported in time series, gauge, bar gauge, stat, and bar chart visualizations.
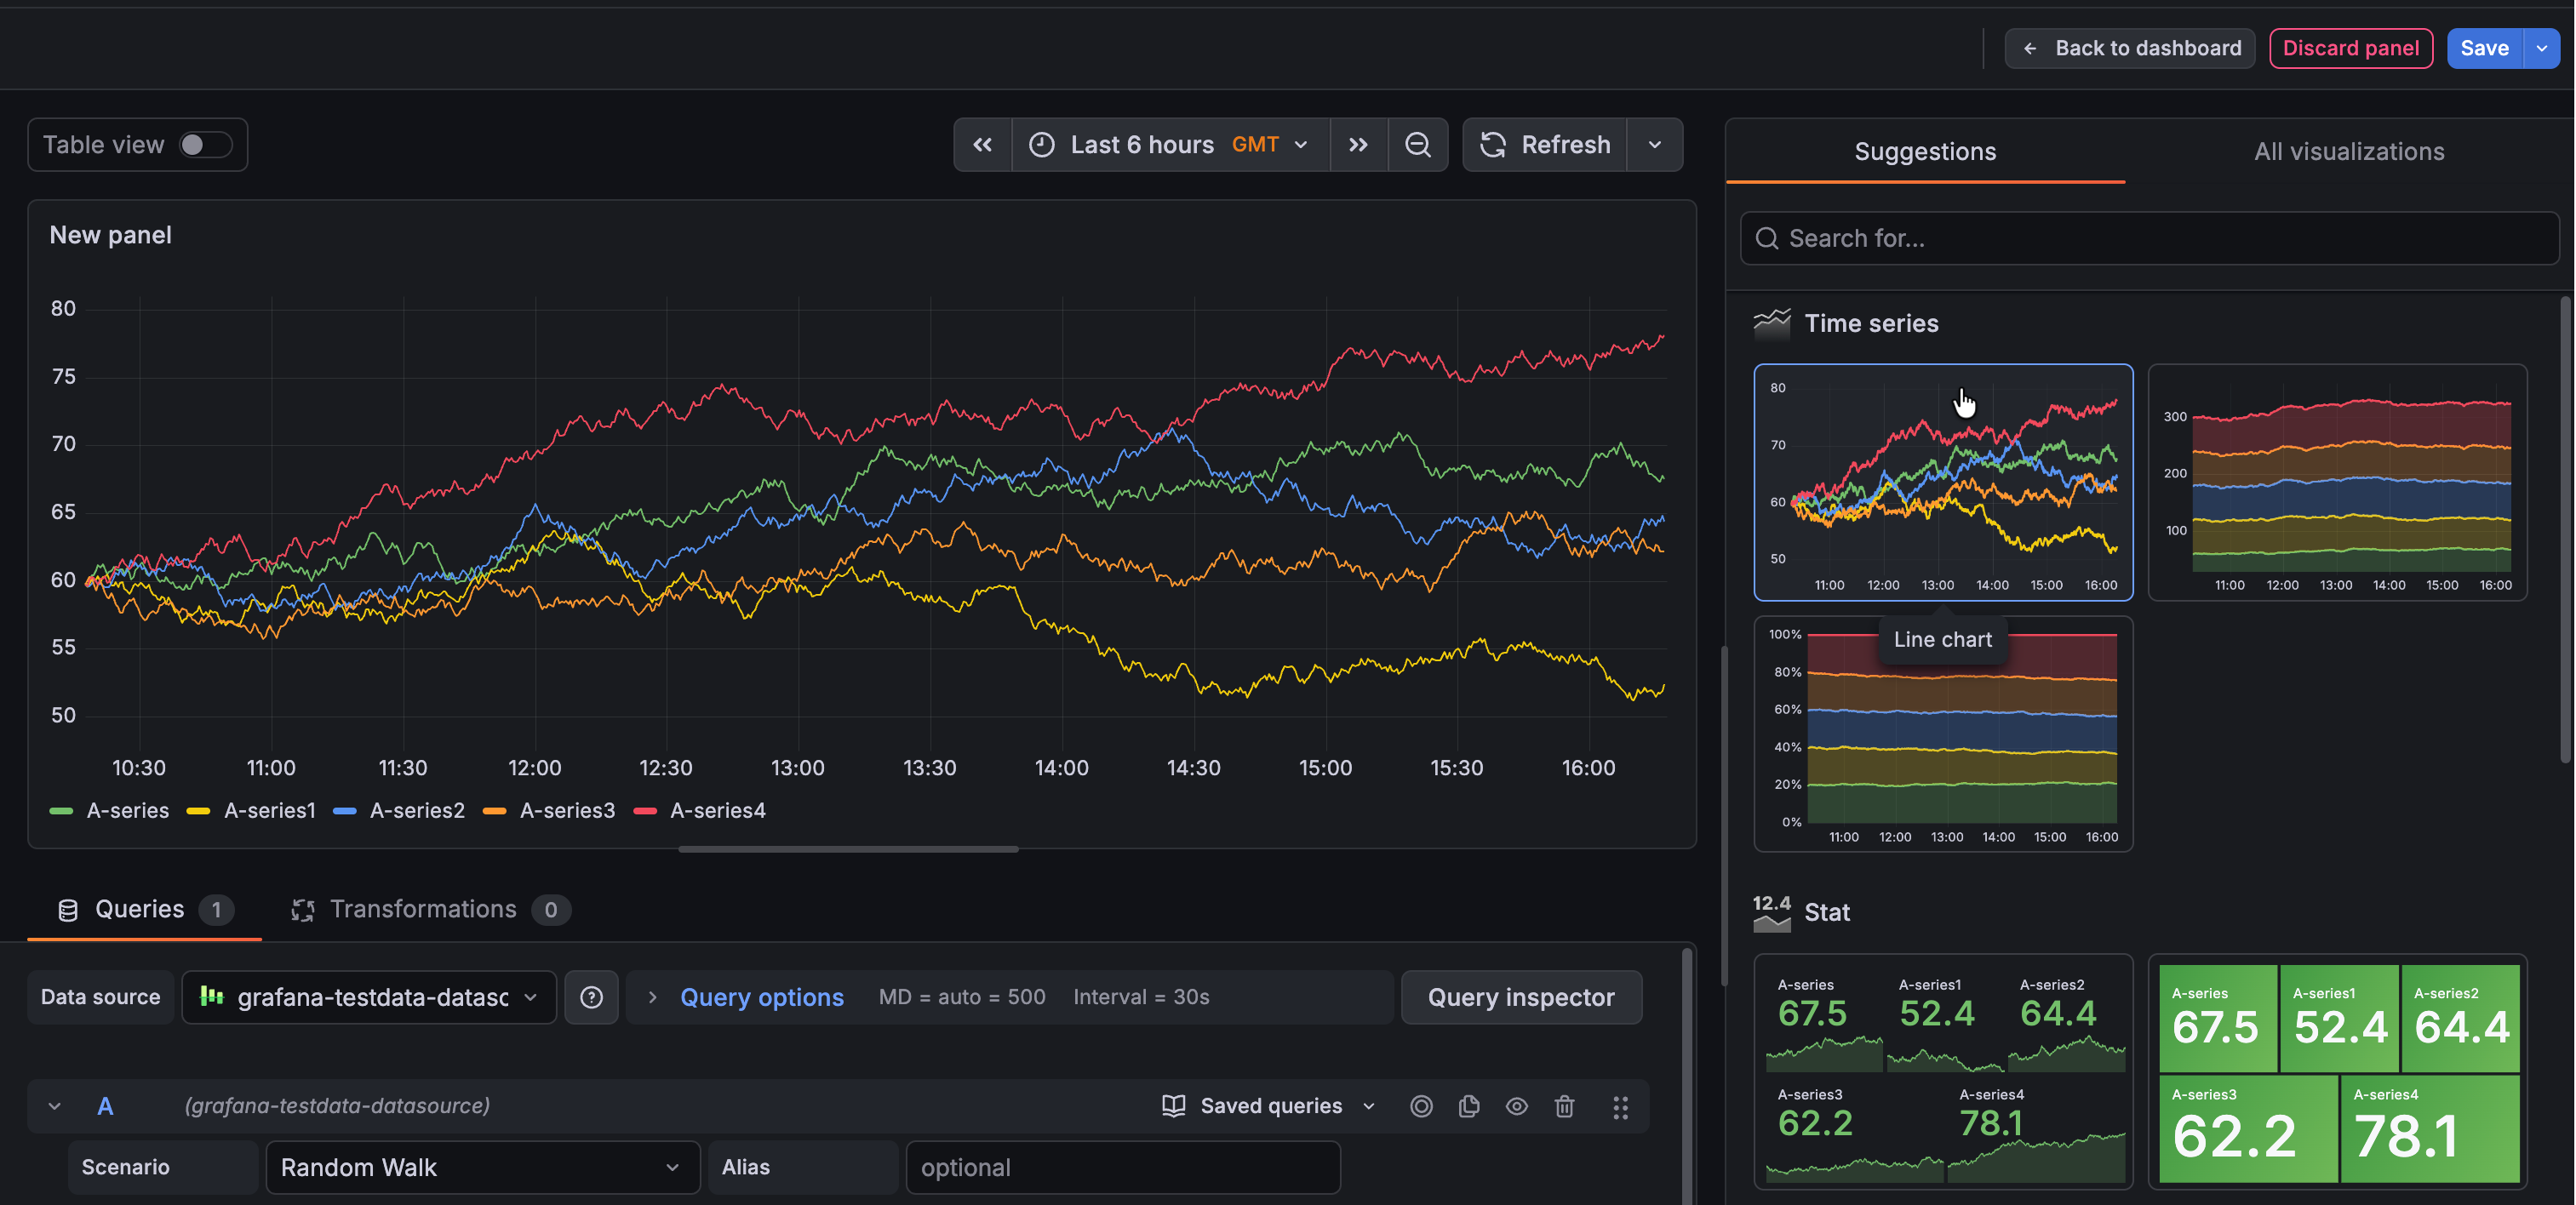
In January 2026, we announced improvements to visualization suggestions in public preview. These changes included higher quality suggestions leveraging information provided by data sources, as well as minor user interface updates. These improvements are now generally available.
We’ve renamed Ad hoc filters variables as simply Filters.
However, in the dashboard schema, they’re still referred to as "kind": "AdhocVariable".
Kubernetes Monitoring has enhancements for faster troubleshooting and improved user experience:
- Health page shows a live snapshot of active issues across all your Clusters. The Risks tab surfaces reliability and availability problems across twelve checks, while the Efficiency tab highlights resource configuration gaps such as missing requests or limits and over-provisioned CPU or memory.

- Flame graphs are embedded in Workload and Pod detail pages. You can investigate which parts of your code are consuming the most CPU or memory without leaving Kubernetes Monitoring.

- Simplified configuration page showing four basic steps to configure using the Kubernetes Helm chart.
Set alerts scoped to specific teams, services, environments, and more using cost attribution labels
We’re excited to announce the general availability of Attribution Alerts in the Cost Management and Billing app!
The Alerting sidebar navigation has been refreshed for a new, more logical menu structure with new tabs added to the pages.
The Alert activity menu item now contains two tabs, one for Alerts, and another for Active notifications.
We’ve introduced several improvements to annotations to make them easier to explore, navigate, and manage at scale.
Annotation clustering
Group adjacent point annotations into a single combined region with the Annotation clustering switch. Clustered annotations aggregate their contents into a single, scrollable tooltip, so you can explore dense annotation data without overwhelming the panel.
Take full control of how you monitor your cloud services.
Cloud Provider Observability now lets you bring your own dashboards, offers you the ability to customize instance drilldown view panels, and make these assets available across all your teams. Everyone can monitor cloud services with the same trusted views, while still having the flexibility to tailor what they see.
Grafana Assistant arrives in Slack and lets you troubleshoot while on the go and with your colleagues in real-time.
Grafana Assistant in Slack allows you to access the data and knowledge in Grafana Assistant in Slack. Ask about your traces, metrics, the latest deployment and how to fix high p99 latency in your search service.
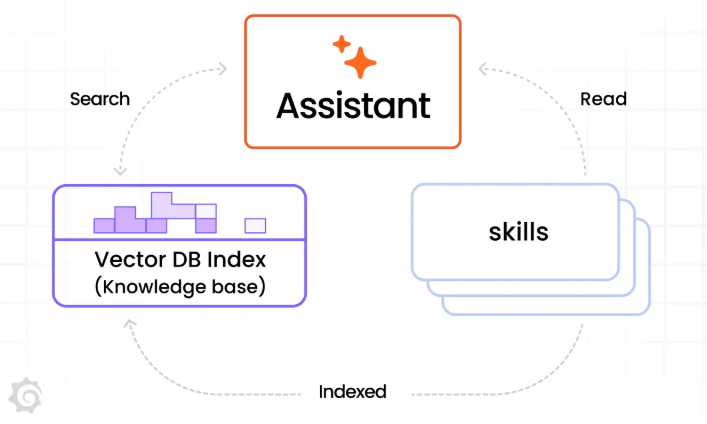
Skills are now generally available for all Grafana Assistant users.
Skills let you write runbooks, workflows, hints and context guides so that the Assistant can drill down even better in your stack. You can also associate slash commands with Skills so that /my-skill brings up your Skill and the Assistant works through it specifically.
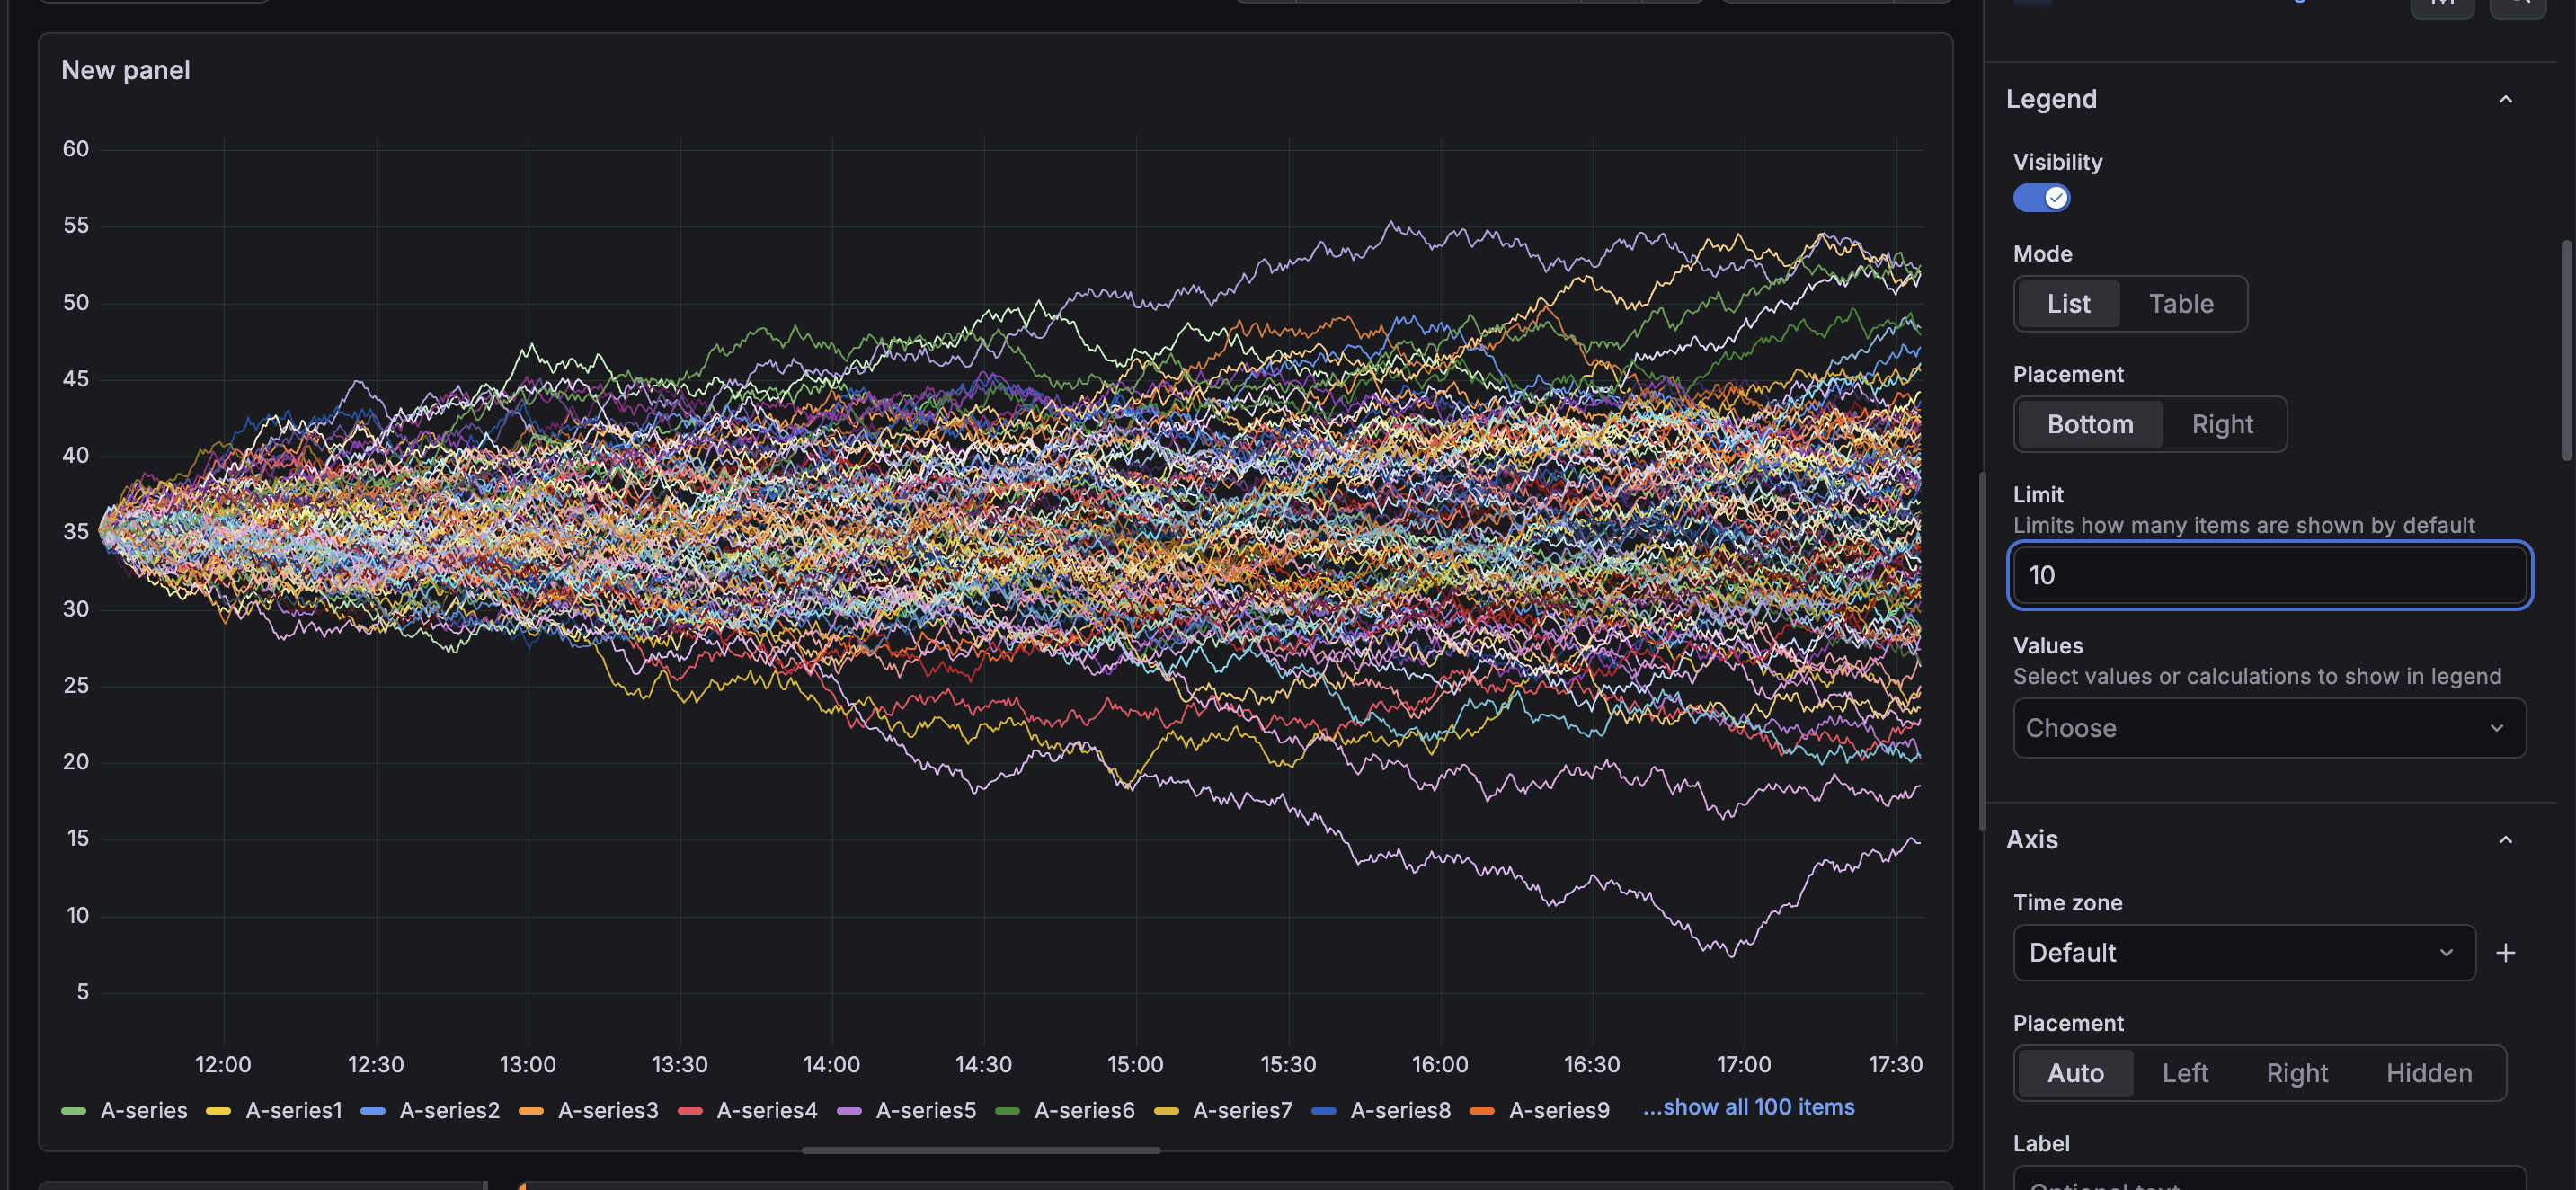
Panels displaying hundreds or thousands of series can potentially run into performance bottlenecks when rendering their legends. Each legend item adds DOM nodes to the page, and that can add up when your visualization displays thousands of series. It can also be visually distracting if your user is not actively engaging with the legend.
Cloud Provider Observability now delivers broader Azure metric coverage and more precise metric behavior across key resource types including Azure Cognitive Services and Azure Front Door. This update adds important new metrics, expands dimension support, and refines aggregations so teams can monitor Azure services with better depth and consistency.
Grafana Assistant arrives in the CLI!
Use Grafana Assistant right in the CLI alongside all the other tools you use for your observability job. In the CLI, the Assistant can help you with all the things it can also do in the browser or in Slack. Ask about recent errors, latency or traces - get the answer in the CLI. With the CLI, Grafana Assistant can also read, create, update and delete local files for you: bring observability, coding and configuration closer than ever in one tool without the need to context switch.