What's new from Grafana Labs
Grafana Labs products, projects, and features can go through multiple release stages before becoming generally available. These stages in the release life cycle can present varying degrees of stability and support. For more information, refer to release life cycle for Grafana Labs.
Loading...
Area of interest:
Cloud availability:
Cloud editions:
Self-managed availability:
Self-managed editions:
No results found. Please adjust your filters or search criteria.
There was an error with your request.
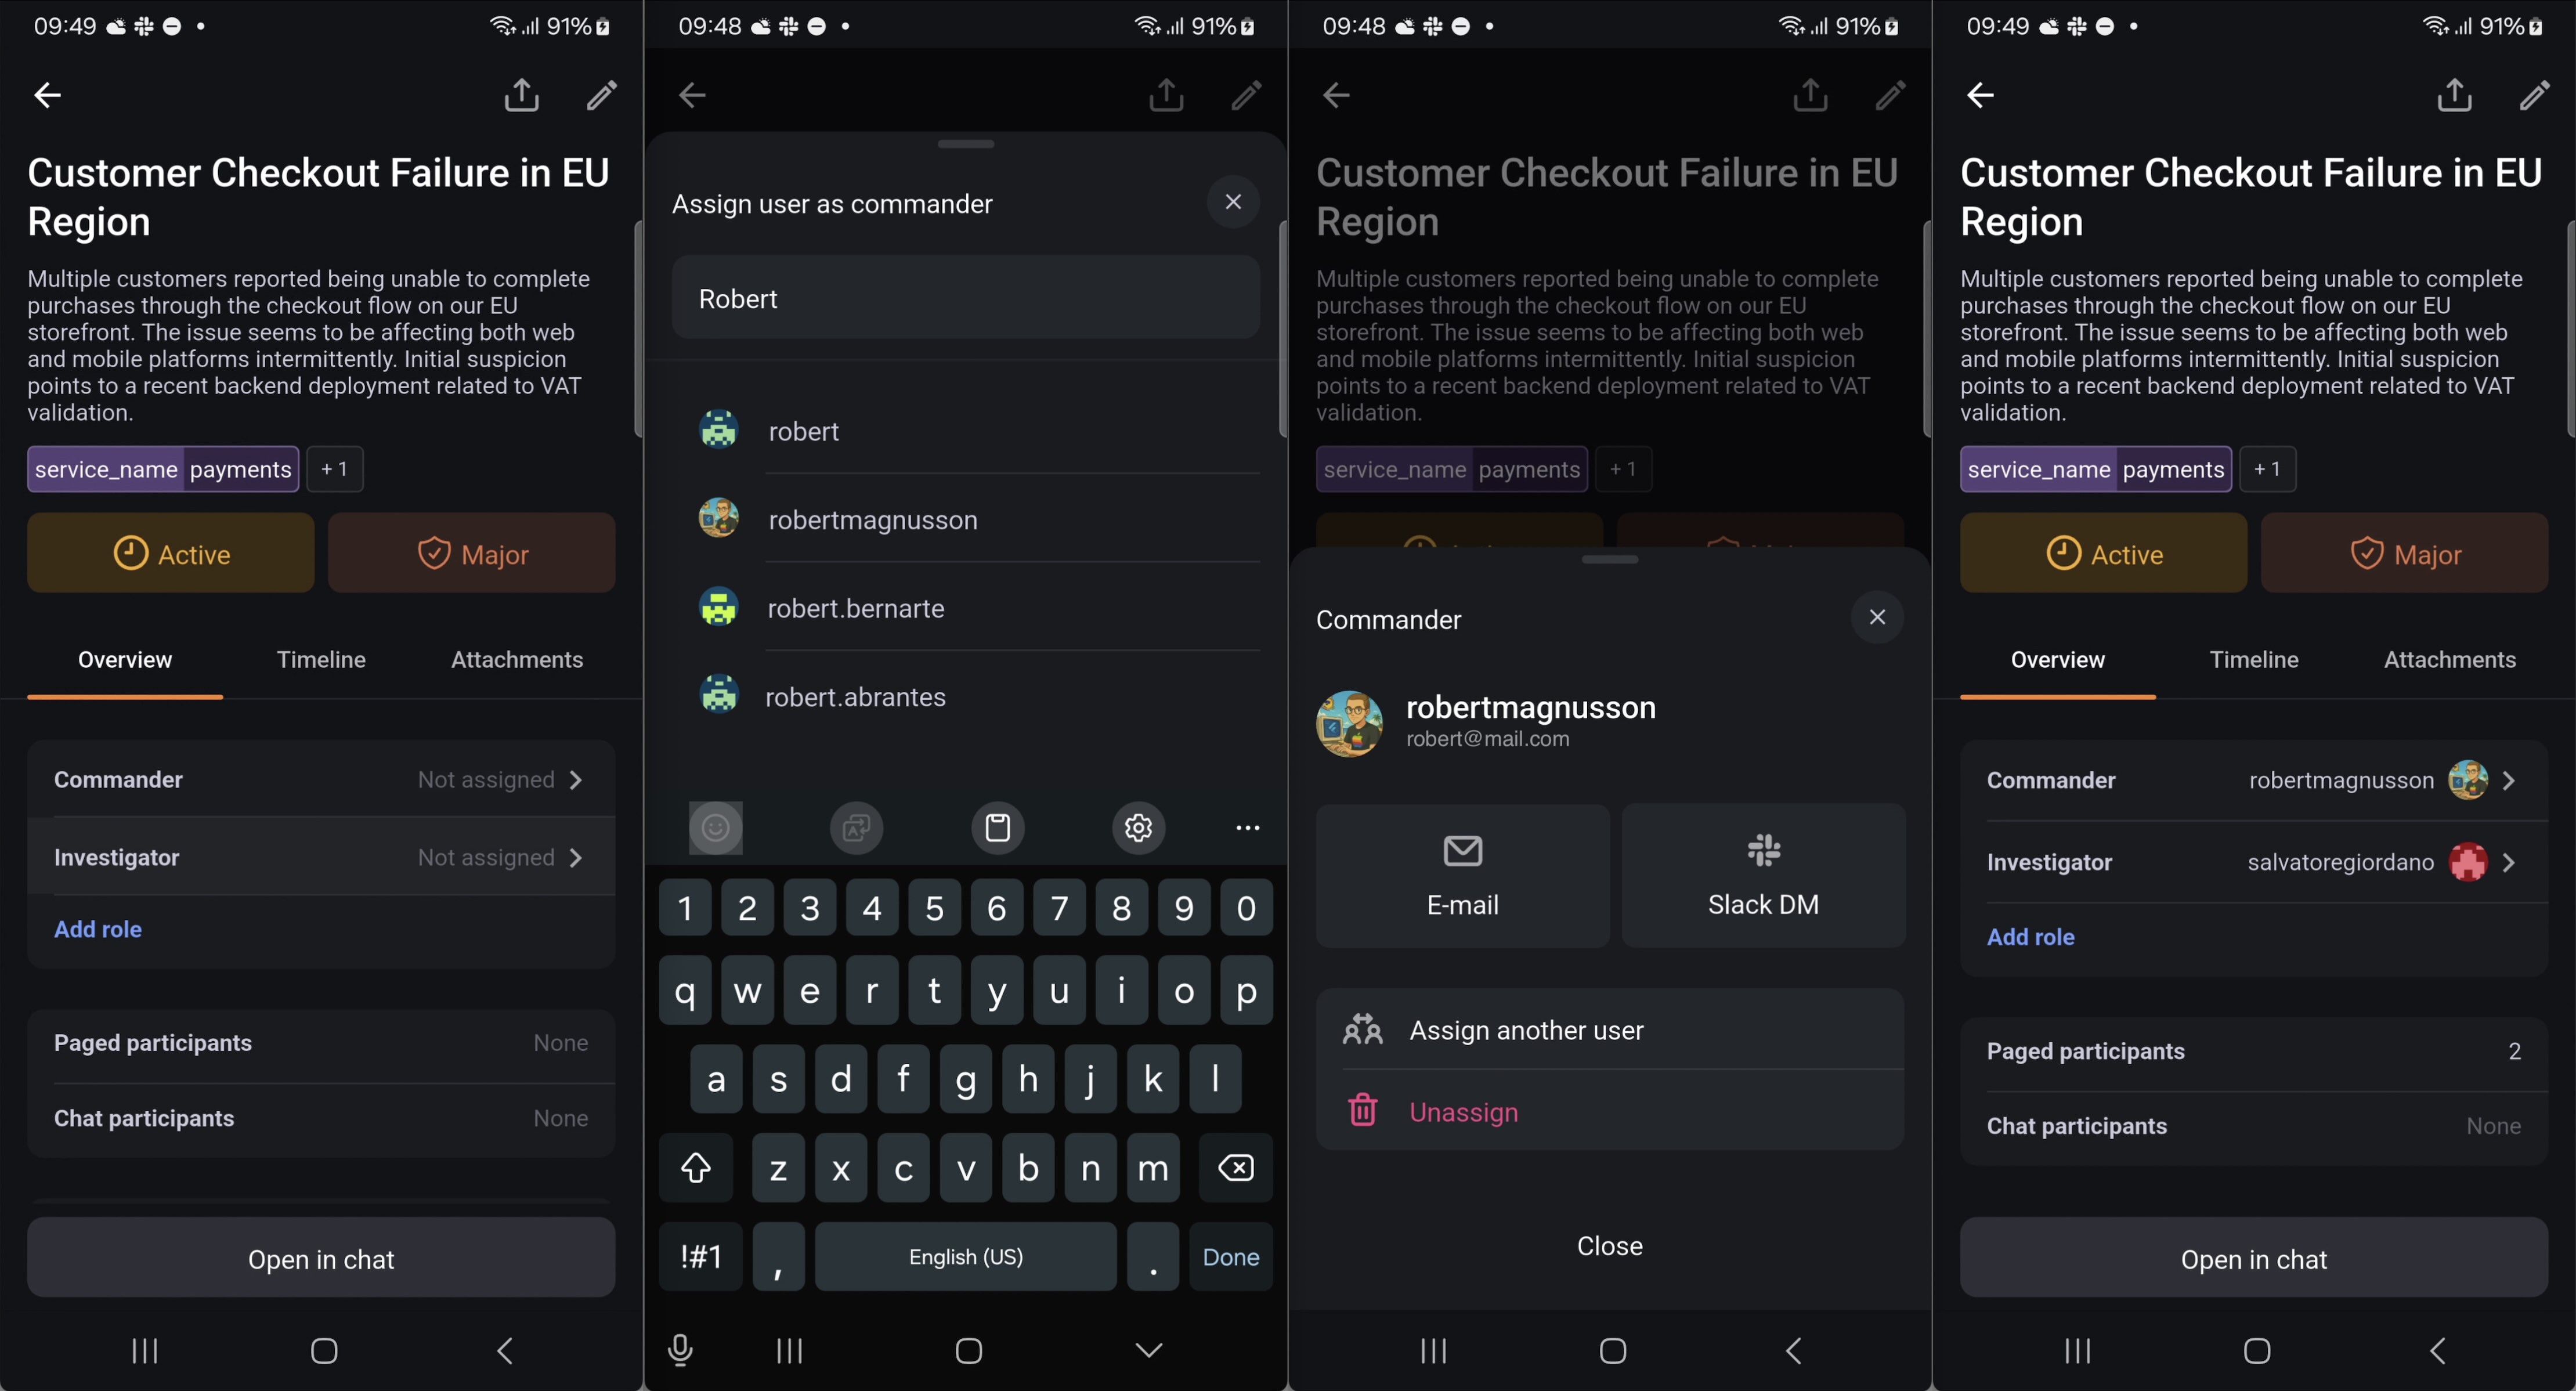
We continue adding more functionality to the IRM mobile app to make incident management smoother and more flexible, allowing you to react instantly from anywhere.
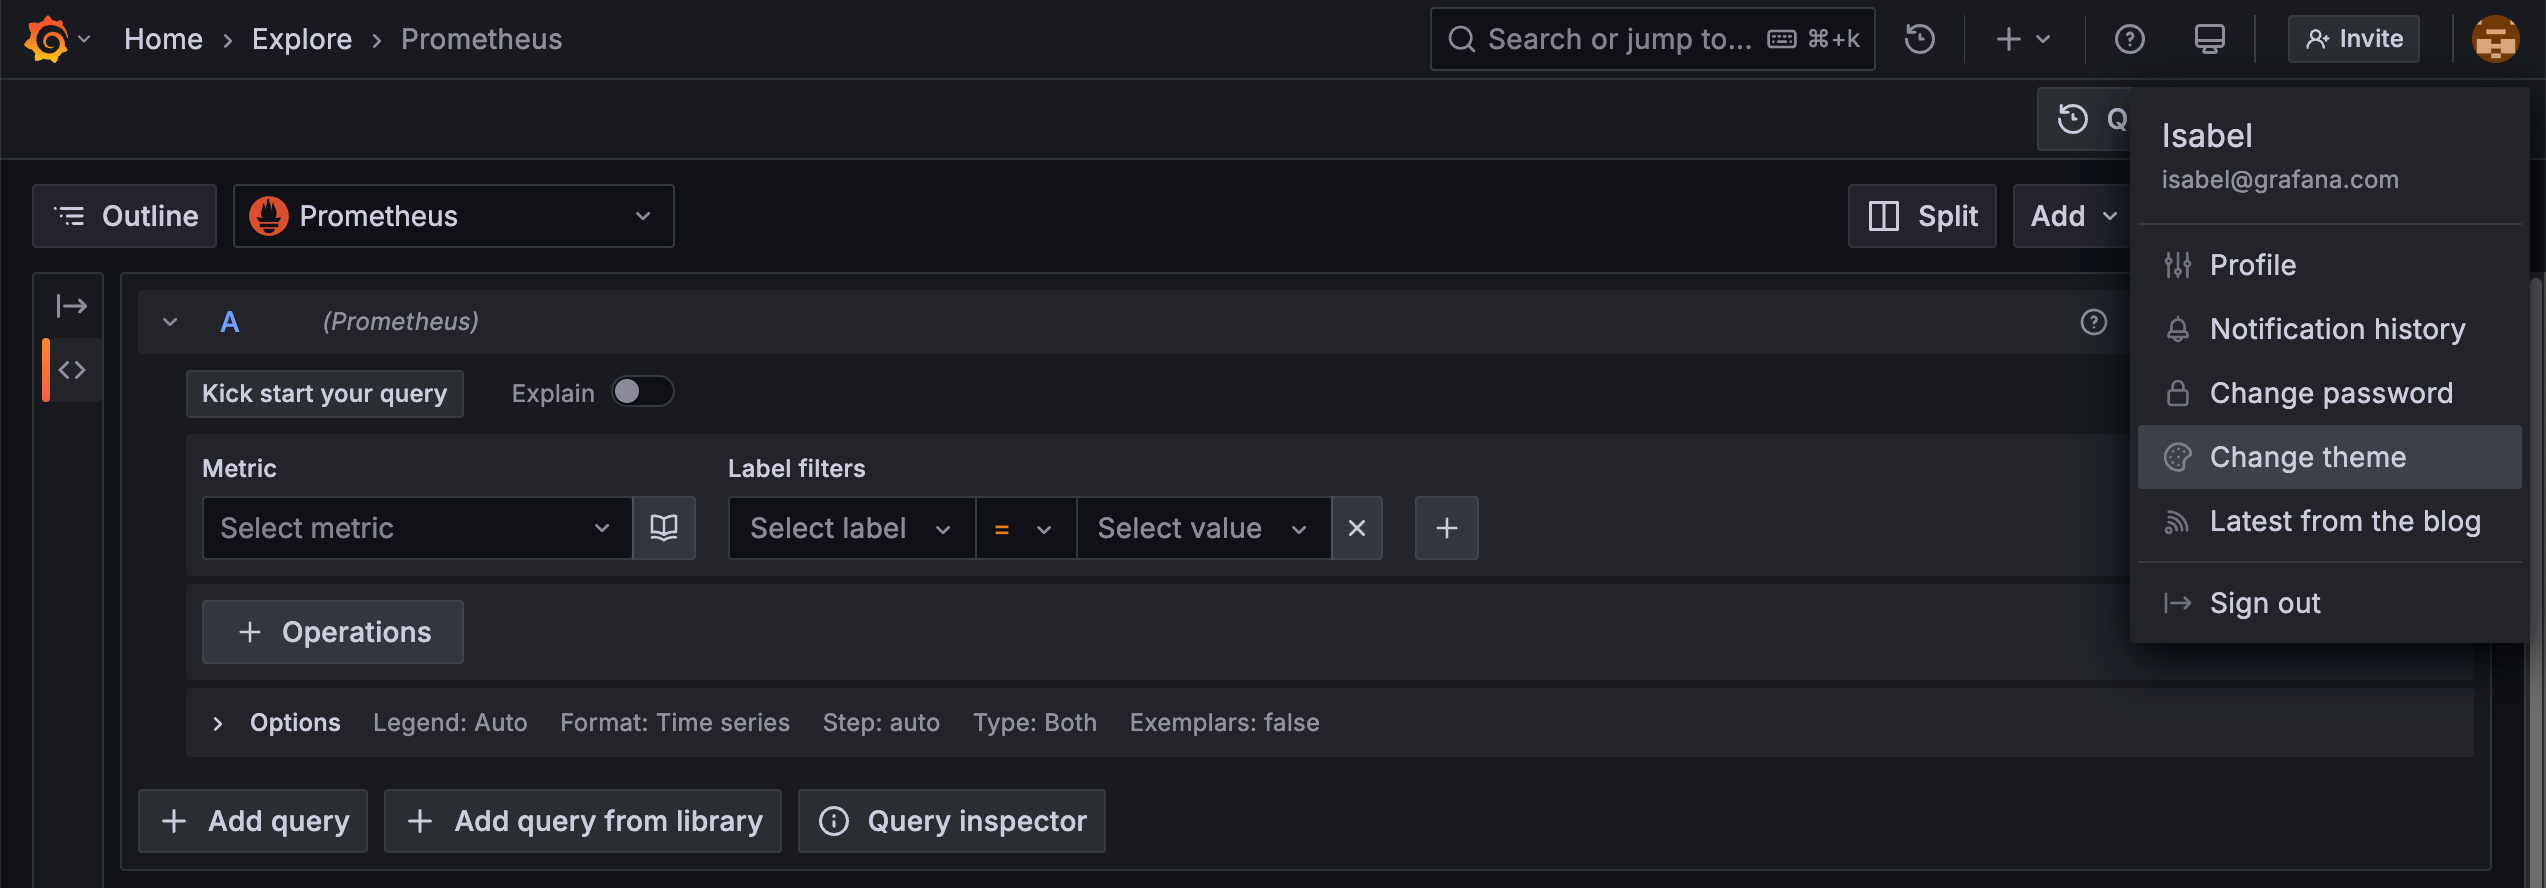
We’re giving the community early access to several new experimental themes to celebrate the release of Grafana 12! You can jazz up your Grafana experience with Sapphire dusk, Tron, Gilded grove, Gloom, or Desert bloom. To see the color scheme of a theme before selecting it, click the user icon in the top-right corner of the page and select Change theme.
Last year, we migrated our dashboard architecture to the Scenes library, unlocking a more stable, dynamic, and flexible foundation for the future of Grafana dashboards. Today, we’re excited to showcase what the team has built on top of it, with a strong focus on improving core user workflows: navigating, consuming, and editing dashboards.
Introducing new controls for Logs in Explore
We’re excited to introduce a new controls component for Logs in Explore, designed to make better use of the layout around logs, and give users greater flexibility when working with log data.
Dynamic Alerting with our Forecasting and Outlier Detection features now supports role-based access control by introducing the new roles ML Editor, ML Viewer, Sift Editor and Sift Viewer.
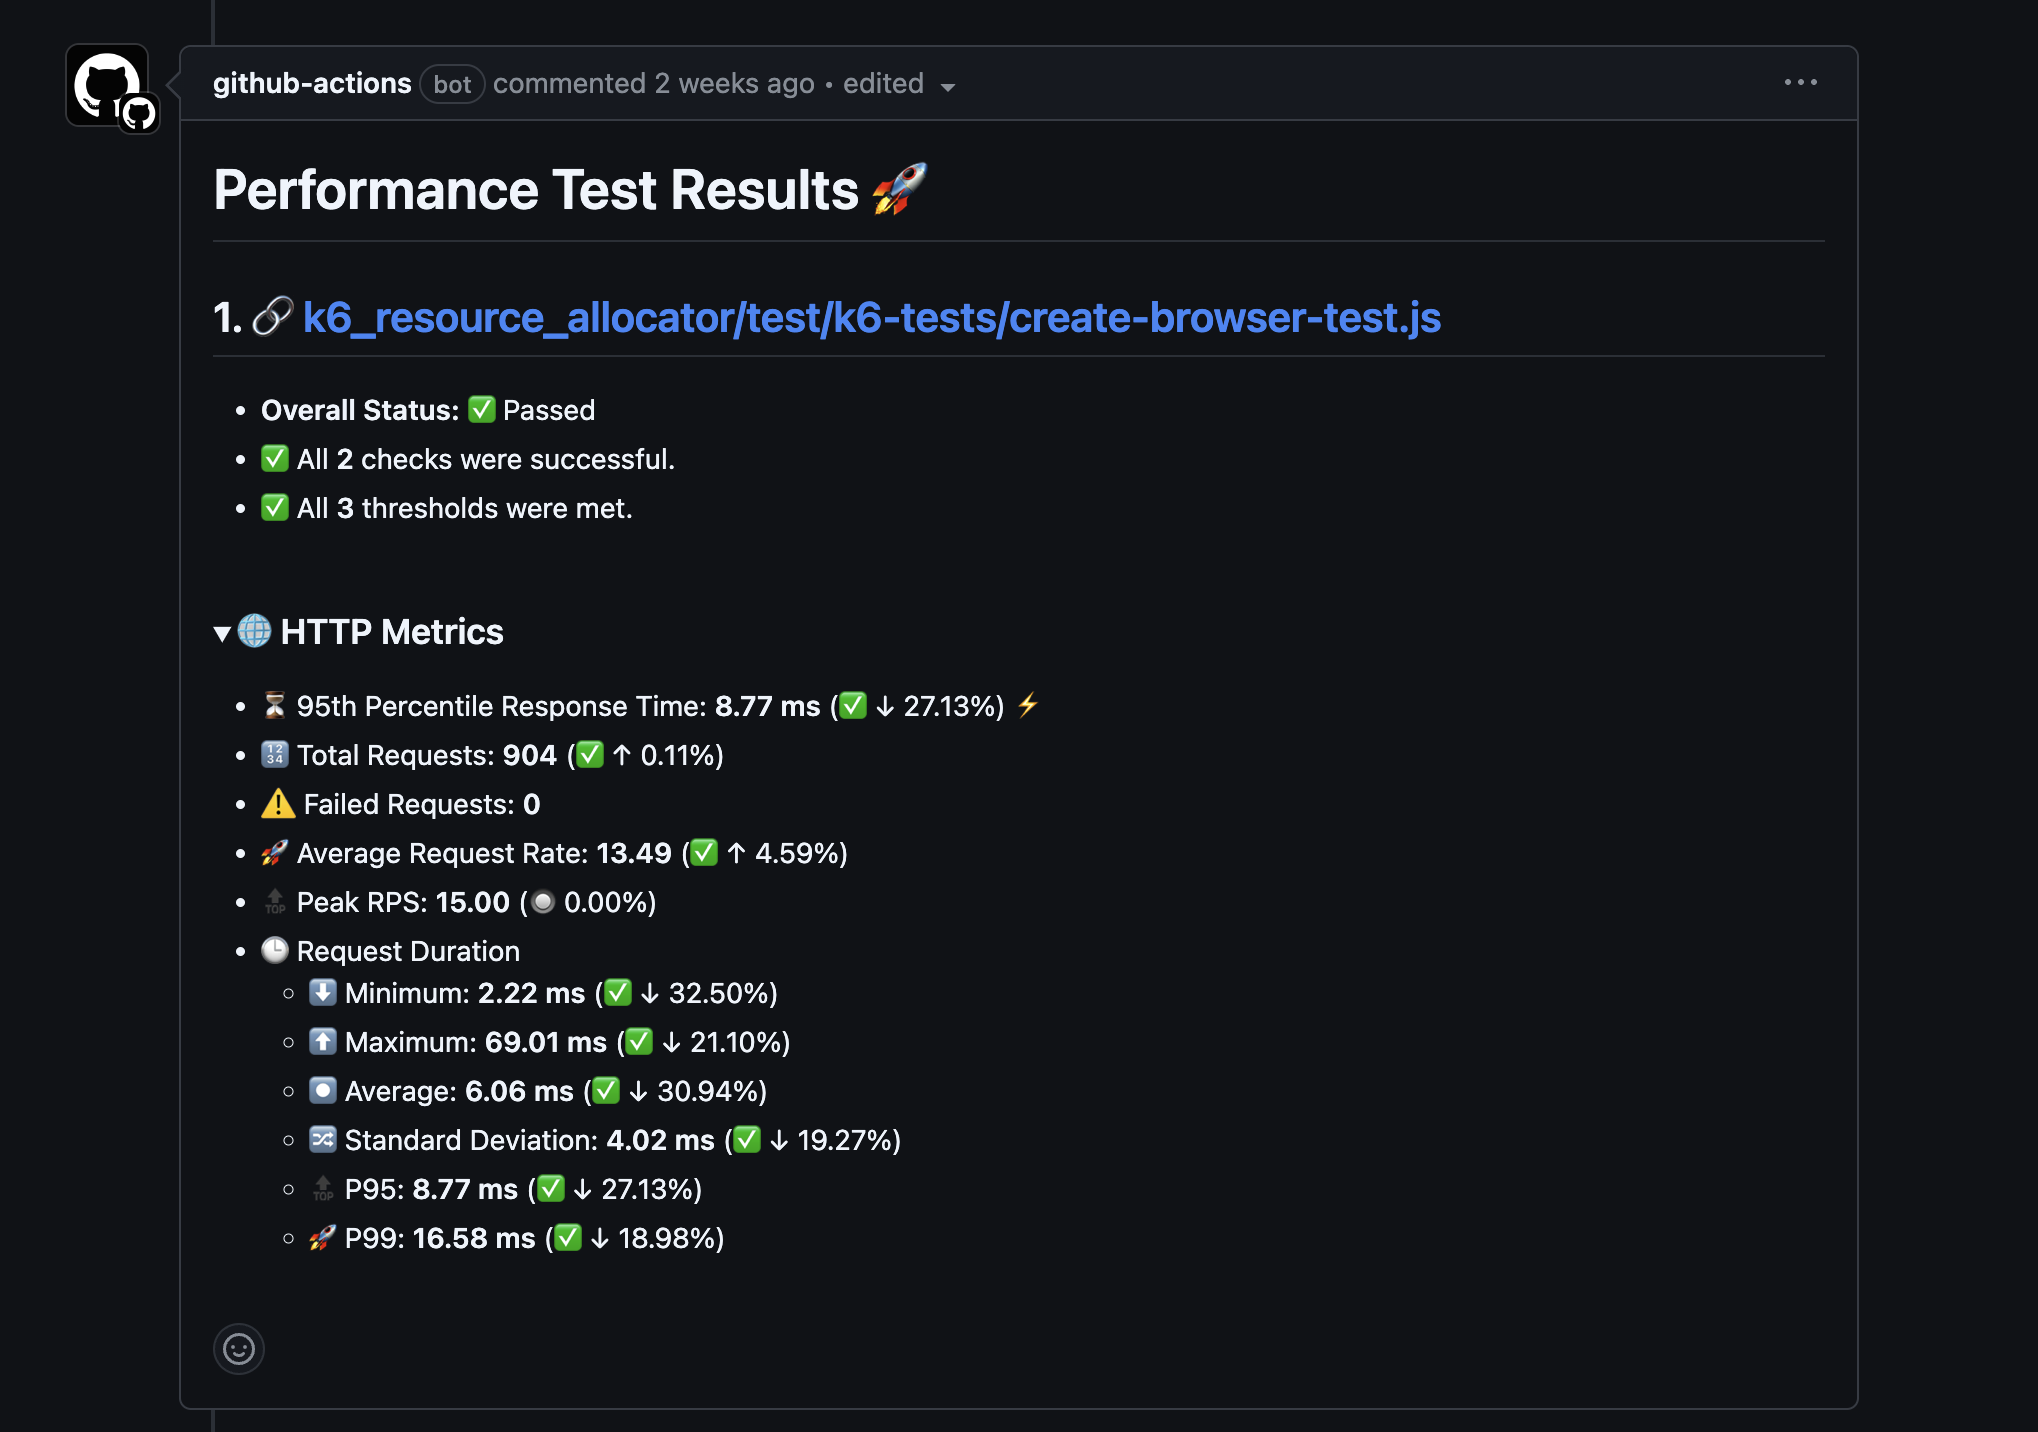
We’ve enhanced our GitHub Actions integration for k6, making it even easier to run performance tests seamlessly within your CI/CD pipelines.
Now, when executing k6 tests in the cloud from a GitHub Actions workflow, the pull request comments will automatically display a rich test summary. This includes key performance metrics like response times, request rates, pass/fail statuses and comparison with the baseline test runs—providing instant, actionable insights without leaving your development workflow.
We are excited to announce that you can now use Terraform to manage Frontend Observability resources.
You can configure a Terraform provider to connect to the Frontend Observability API and manage resources, such as applications.
Grafana Fleet Management now offers an audit trail of configuration pipeline changes. With the Pipelines history feature, your team can collaborate more efficiently, ensure audit compliance, and troubleshoot issues caused by configuration changes.
Filter alerts by alert name for improved MTTR.
We are excited to announce role-based access control (RBAC) in Frontend Observability.
RBAC provides a standardized way of granting, changing, and revoking access when it comes to viewing and modifying Grafana resources, such as dashboards, reports, and administrative settings.
We are excited to introduce Geolocation Insights in Frontend Observability.
Frontend applications often serve a globally distributed user base, meaning that your users can be spread across multiple geographical regions and access your application from diverse locations. In some instances, a user’s location can affect the performance of web applications.
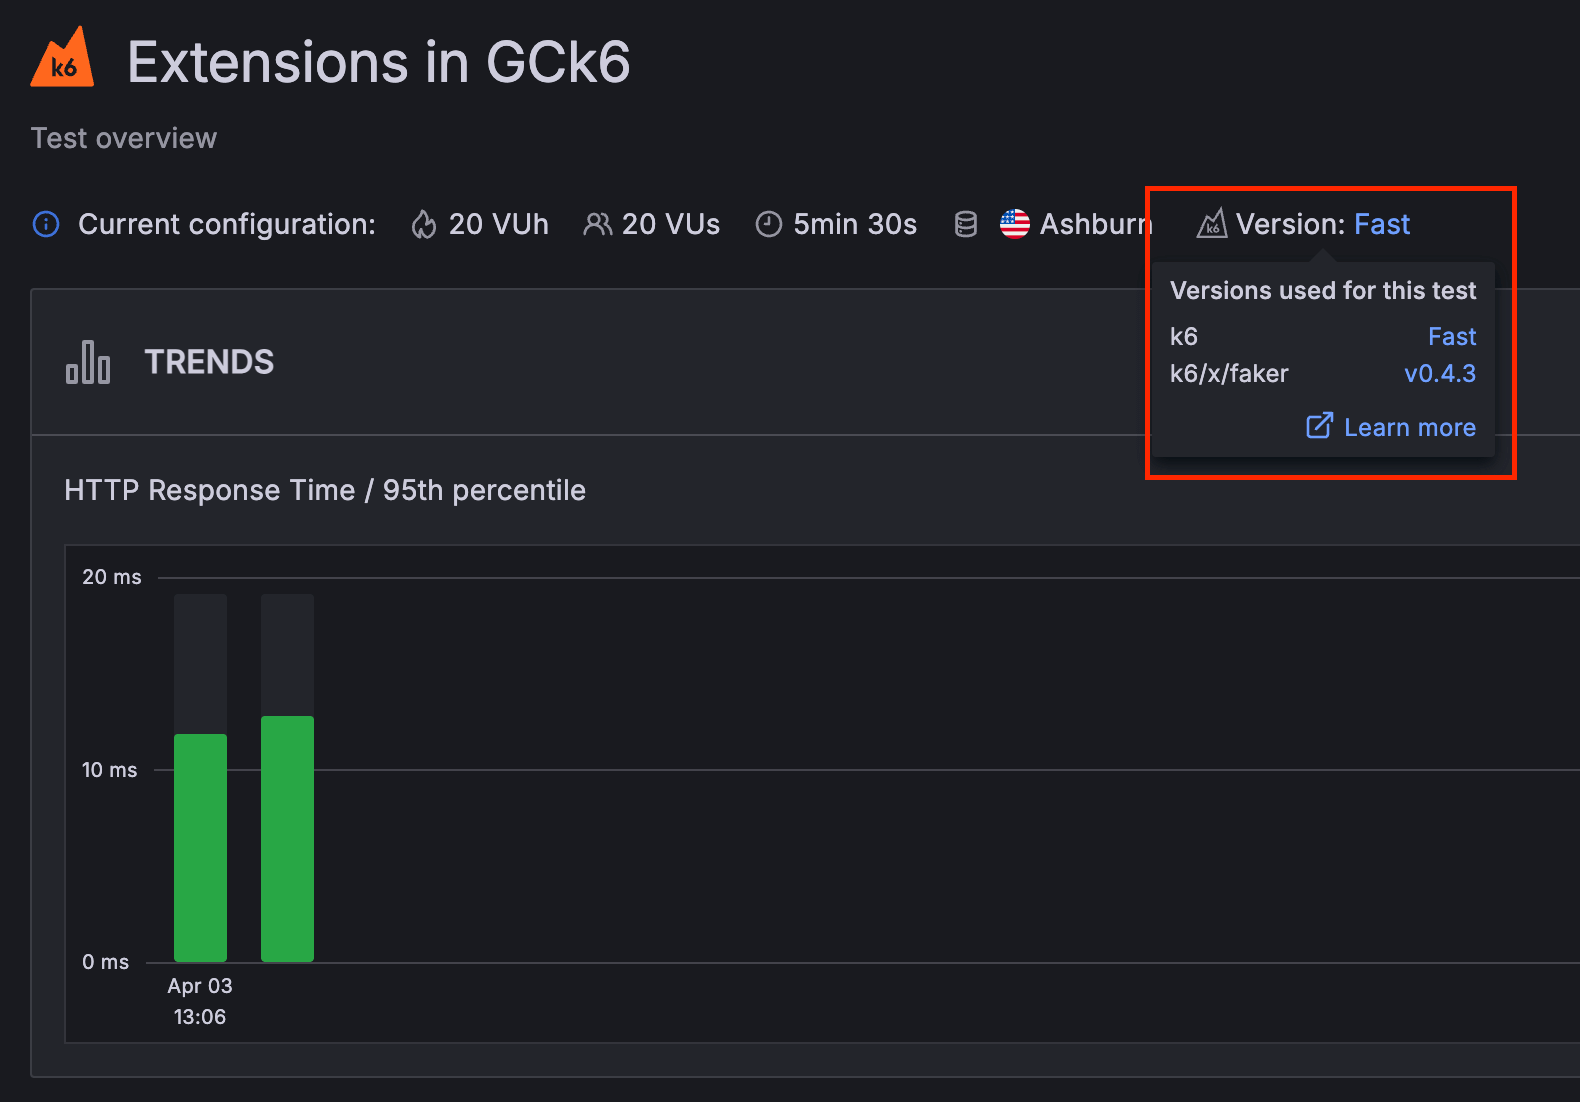
We are excited to announce the public preview of k6 extensions in Grafana Cloud k6.
k6 extensions are libraries that expand the k6 core functionality. For example, the faker k6 extension enables users to generate random fake data, which is not available on k6 by default. Extensions allow the k6 open source project to remain small and focused on its core functionality, but still provide users with a way to add new features to cover any use case, such as supporting a new network protocol.
We’re excited to announce the private preview release of new alerting capabilities for Synthetic Monitoring.
You can now create alerts for each check in your Synthetic Monitoring application. For example, you can create an alert based on the number of check failures in a specific time window, with different settings for each one of your checks.
We’ve just shipped a big update to our mobile app that many of you have been asking for - you can now edit incidents directly from your phone!
The LLM plugin is Grafana’s access point for GenAI features within Grafana. With the LLM plugin, you can do the following things:
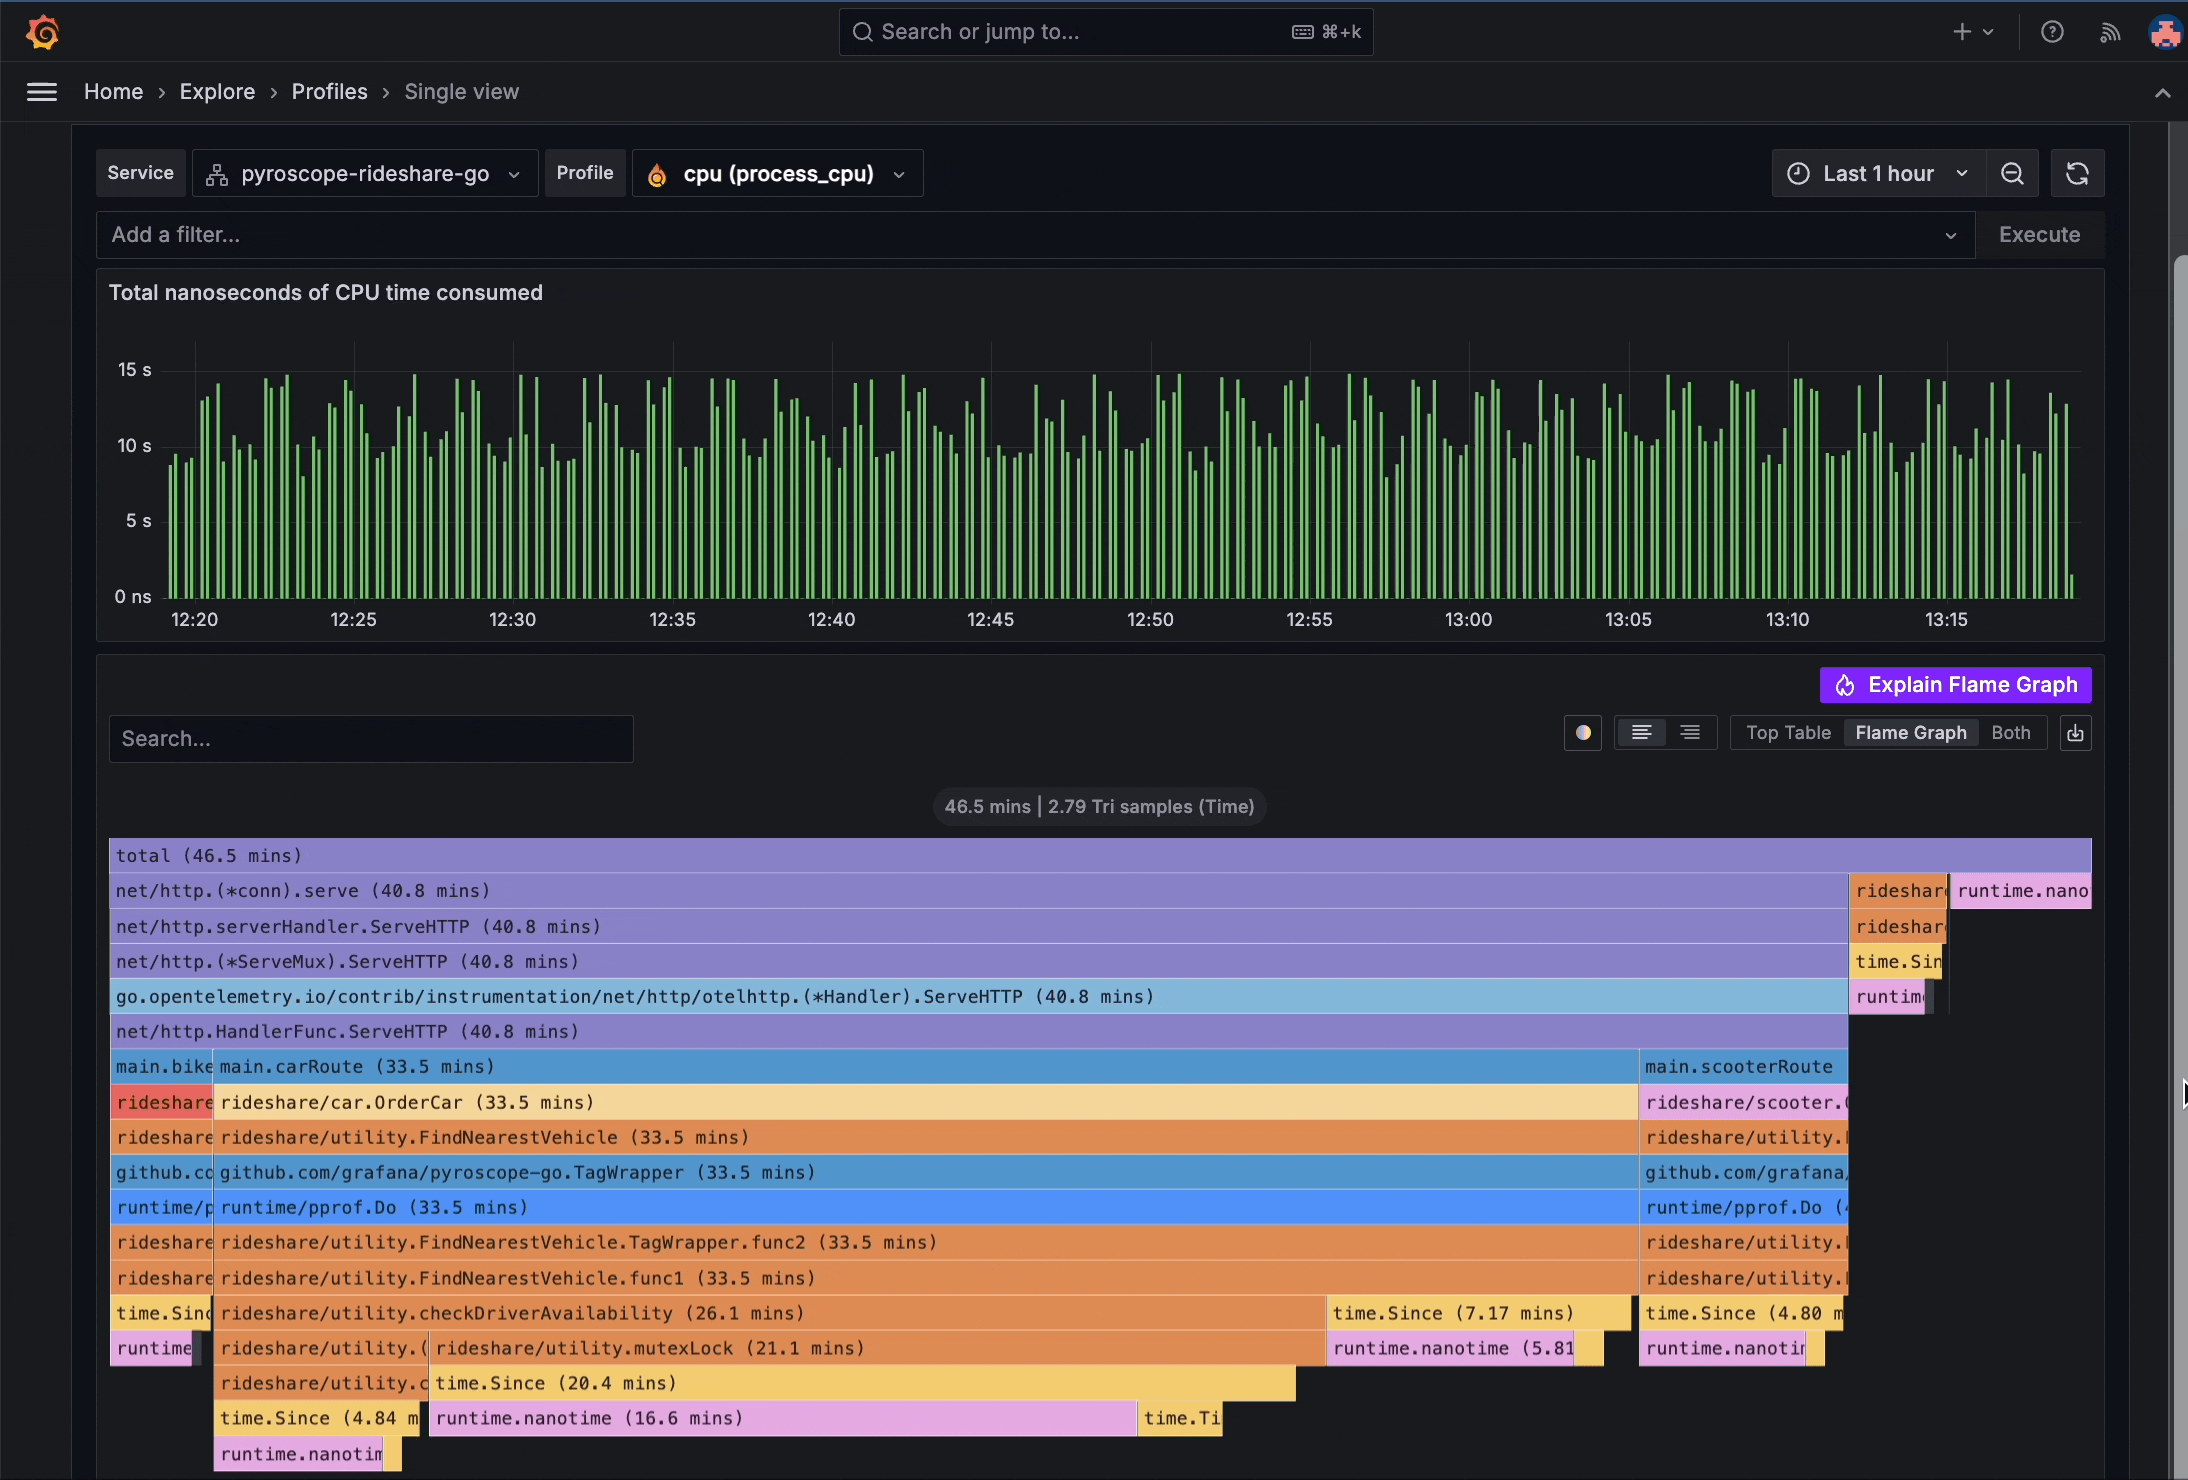
- AI-powered flame graph interpretation
- Incident auto-summary
- Dashboard panel title and description generation
- Explanations of error log lines in Sift
We now support the usage of Anthropic’s API alongside already existing support for OpenAI’s API, OpenAI-compatible APIs and custom APIs.