
What's new from Grafana Labs
Grafana Labs products, projects, and features can go through multiple release stages before becoming generally available. These stages in the release life cycle can present varying degrees of stability and support. For more information, refer to release life cycle for Grafana Labs.
Loading...
Area of interest:
Cloud availability:
Cloud editions:
Self-managed availability:
Self-managed editions:
No results found. Please adjust your filters or search criteria.
There was an error with your request.
We’re excited to introduce SLO Reports—a powerful new feature in Grafana SLO that enables users to report on multiple service level objectives (SLOs) on a weekly or monthly basis.
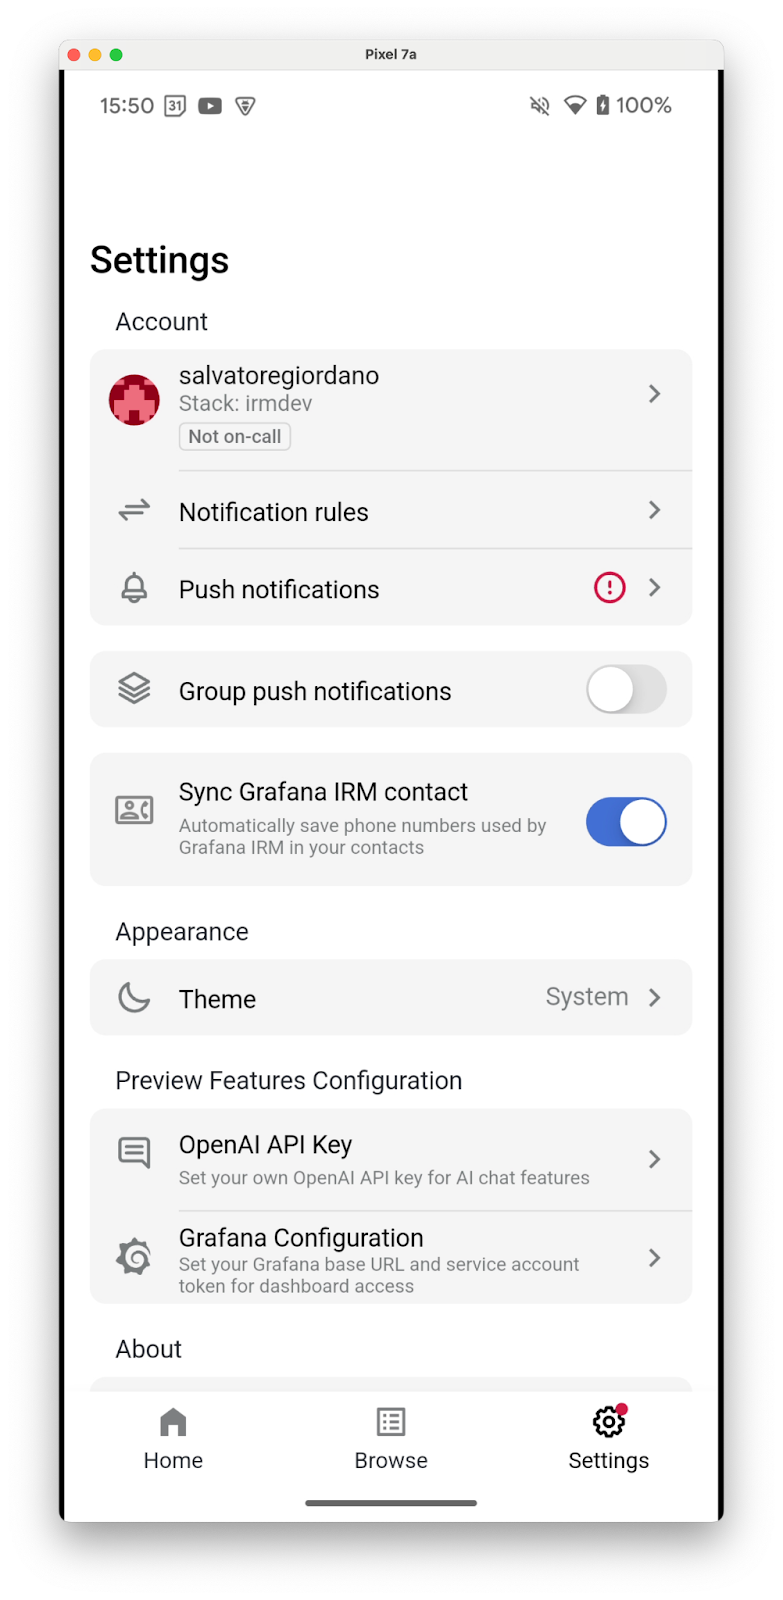
You can now sync Grafana IRM’s phone numbers to your mobile contacts. This helps you recognize IRM calls and allows you to bypass Do Not Disturb (DnD) for urgent alerts.
Kubernetes Monitoring offers CPU tabs with insightful panels on every detail page beyond the container page to provide you with quicker troubleshooting and better resource planning. You can gain deeper visibility from cluster to pod with utilization efficiency graphs and CPU distribution analysis.
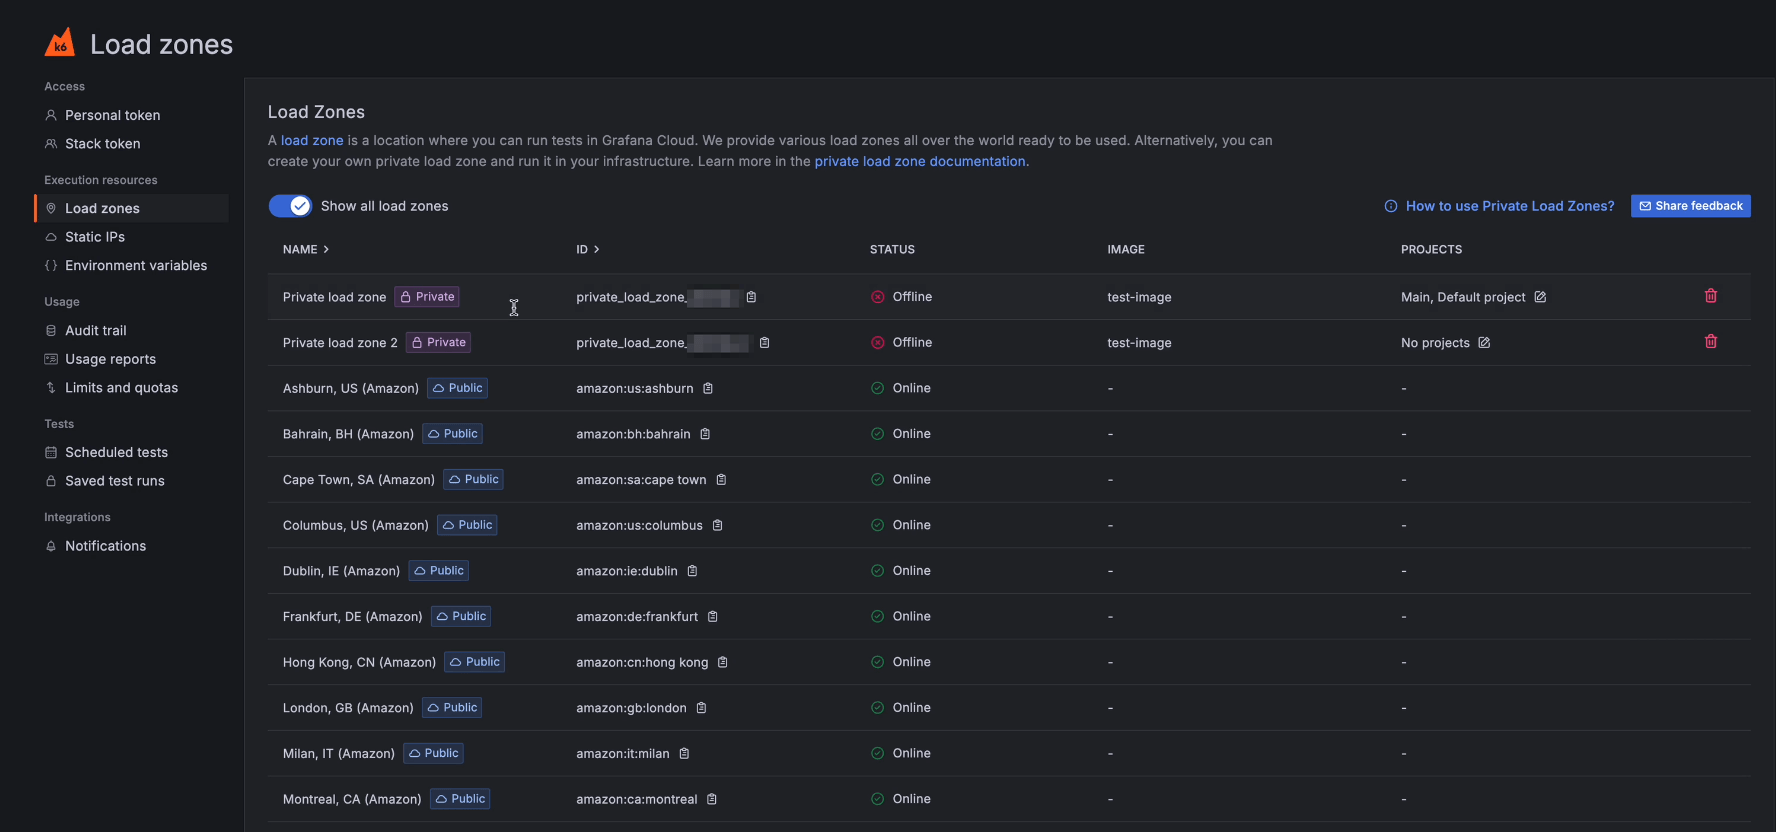
You can now restrict Private Load Zones (PLZs) in Grafana Cloud k6 to be used by a limited set of projects.
This feature lets you assign projects to a PLZ so that only tests inside of that project can be run on a specific PLZ.
We’re excited to announce that Role-Based Access Control (RBAC) for Synthetic Monitoring is now generally available! This gives you the ability to fine-tune access and permissions within Synthetic Monitoring, offering greater control over who can access specific features.

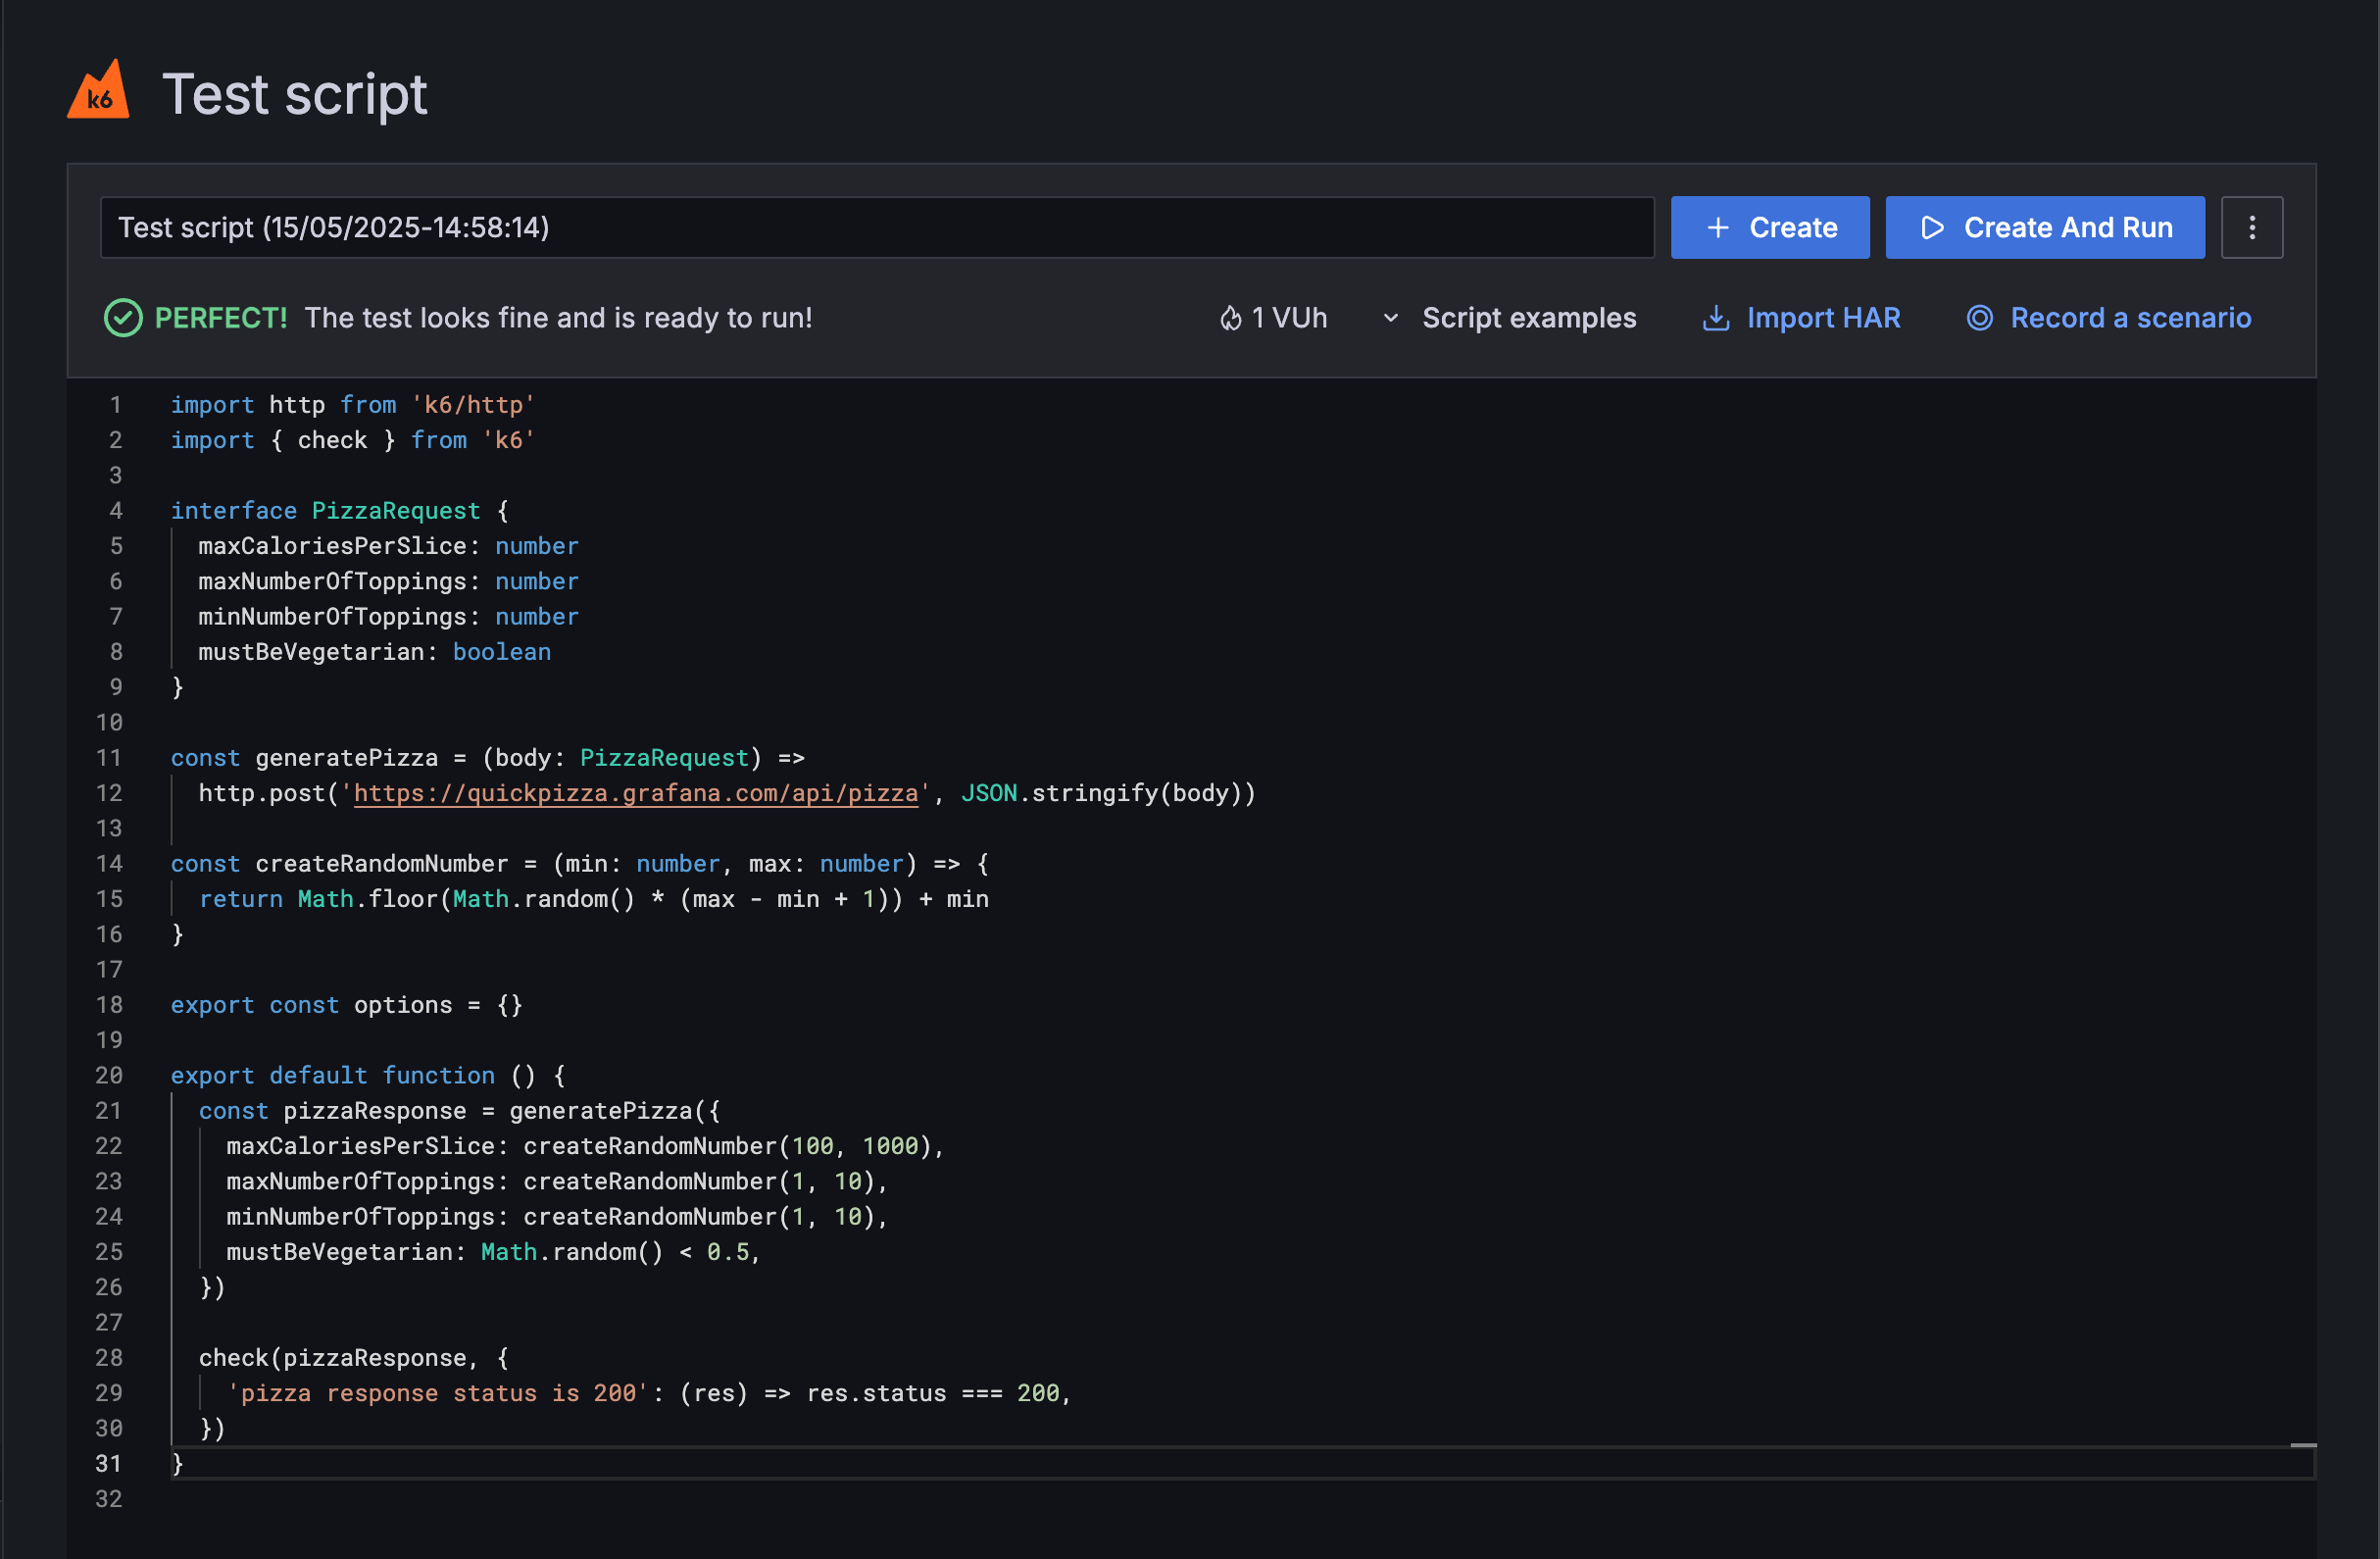
Native TypeScript support is now available in the Grafana Cloud k6 Script Editor, allowing you to write type-safe code in the cloud without any additional setup.
You now have more flexibility to tailor Grafana IRM to your team’s specific incident response workflows with several new customization options:
- Custom incident statuses: Define additional phases, such as Investigating or Monitoring, to go beyond the default Active and Resolved statuses. Custom statuses help responders communicate progress more clearly and give stakeholders better visibility into the state of an incident.
- Custom metadata fields: Capture the information that matters most to your organization. Add custom fields, such as impacted services or involved teams, and even make them required to ensure consistent data collection across incidents.
- Private incidents: Limit visibility for sensitive incidents by declaring them privately. Private incidents automatically create a restricted Slack or Microsoft Teams channel and give you control over who has access throughout the incident.
To learn more, refer to the documentation on incident settings and private incidents.
Dynamic Alerting with our Forecasting and Outlier Detection features has been supporting role-based access control in Public Preview for the last months. We’re excited to announce that this feature is now generally available. This introduces the roles ML Editor, ML Viewer, Sift Editor and Sift Viewer to better manage access to our Dynamic Alerting features.
We’re excited to roll out three powerful enhancements to TraceQL, giving you more flexibility and performance when querying traces in Grafana Cloud with Tempo.
- Rank your metrics with new
topk(n)andbottomk(n)functions to quickly get your highest and lowest ranking time series. - Aggregate spans over time using
sum_over_time()for built-in cumulative sums, such as total bytes, error counts. - Fetch the latest traces first via the experimental
most_recent=truequery hint.
Ranking topk and bottomk functions for TraceQL metrics
When you’re looking at latency, error rates, or throughput across hundreds or thousands of services or endpoints, it’s easy to get lost in all the data. Previously, you’d have to pull back the full set of aggregates and then manually inspect or post‑process the results to find your worst offenders or best performers.
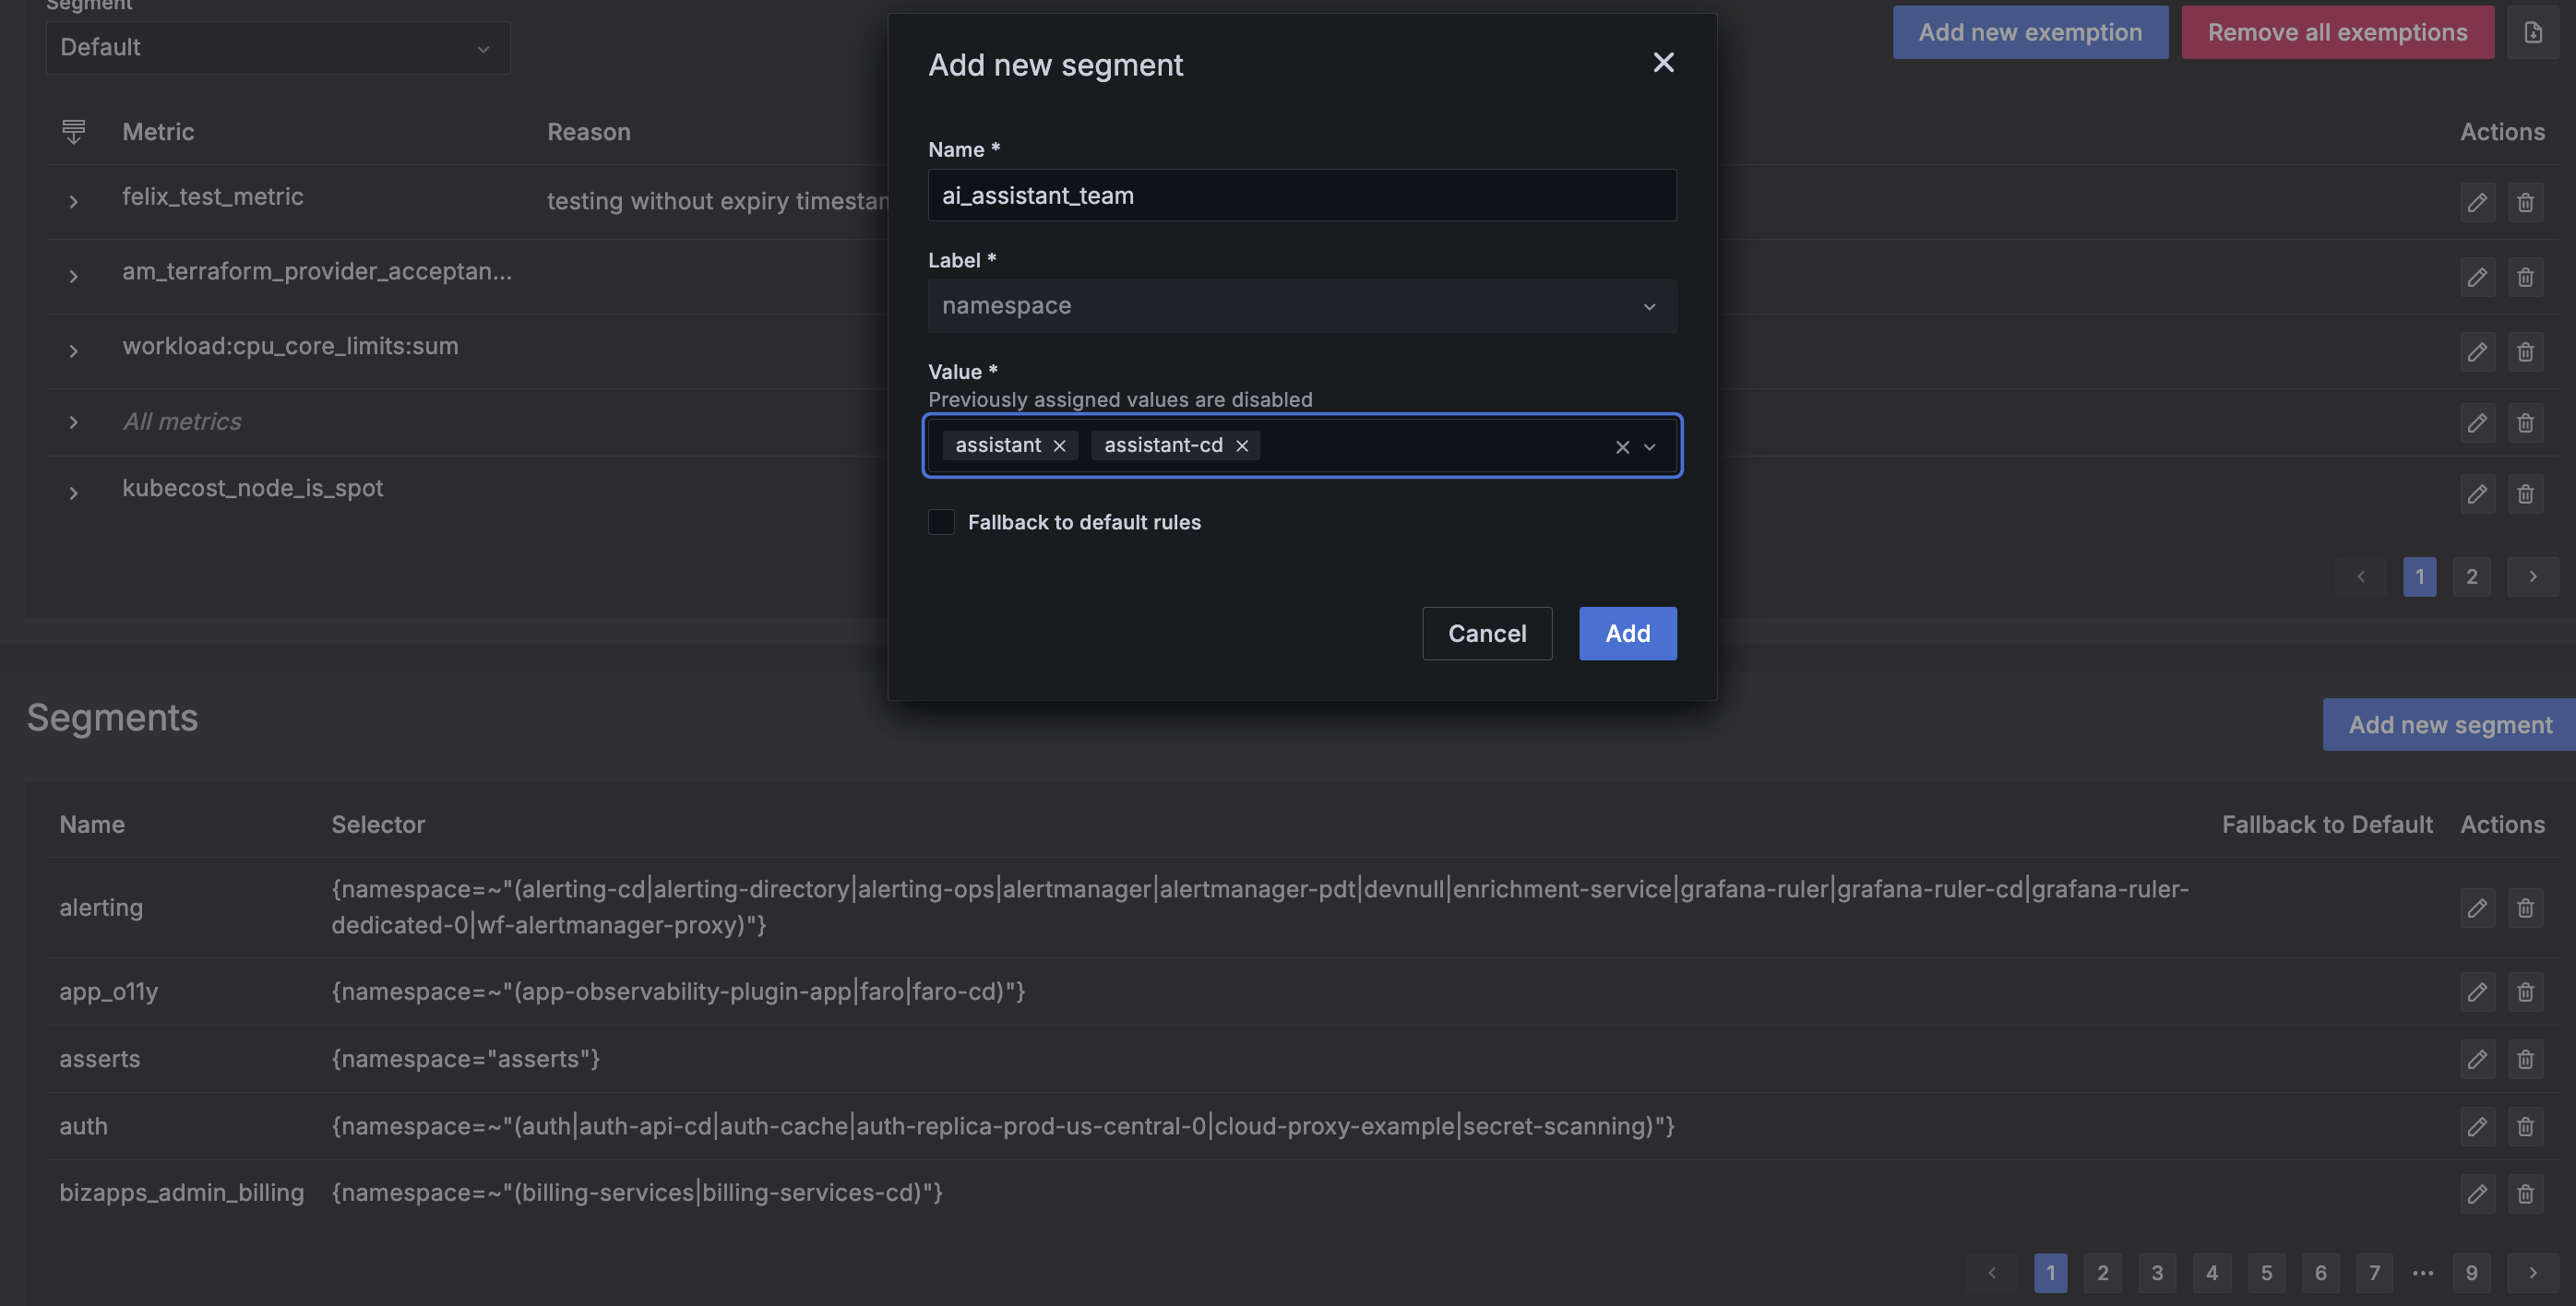
Segmentation allows customers to manage their Adaptive Metrics recommendations on a team, service, or system level, allowing for more granular management of Adaptive Metrics.
You can define label-based segments via a GUI, API, or Terraform. Each segment will then receive its own recommendations; rules and exemptions can then be managed per segment.
Logs Drilldown now contains a JSON viewer for structured log lines. With this new feature, users can more easily view, interact, and of course drill down into their JSON data. This table enables users to filter their JSON log lines so that they can view just the data they need in places like the Log Volume visualization.
Upgrade your Grafana experience with a direct connection with GitHub.
Connect your instance to a GitHub repository, and manage your dashboards as code directly from the Grafana UI. By enabling Git Sync, you will be able to manage dashboards the same way you manage your code. Dashboards will be versioned in Git, and edited through a PR workflow, so that it’s always possible to track changes.
We’ve simplified the migration of data source-managed alert rules to Grafana-managed alert rules.
Using these tools and APIs, you can import data source-managed alert rules from Prometheus-compatible systems (Prometheus, Mimir, Loki) into Grafana as Grafana-managed alert rules. This simplifies migrating from data source alerts to Grafana Managed Alerts while preserving behavior of the rules. Alert rules can be imported from an easy-to-use UI tool or through API endpoints compatible with Mimirtool.
Flapping alerts can cause noise and obscure other issues. Now you can set the minimum amount of time that an alert remains firing after the breached threshold expression no longer returns any results. This sets an alert to a “Recovering” state for a duration of time so a re-triggered threshold incurred during this period won’t trigger a new alert.
You can now restore or permanently delete recently deleted Grafana-managed alert rules. Go to Alerts & IRM > Alerting > Recently deleted to see this function in action.