Synthetic Monitoring: Timepoint Explorer
We’ve enhanced the check results page with a new Timepoint Explorer, making it easier to understand exactly when and where issues are occuring.
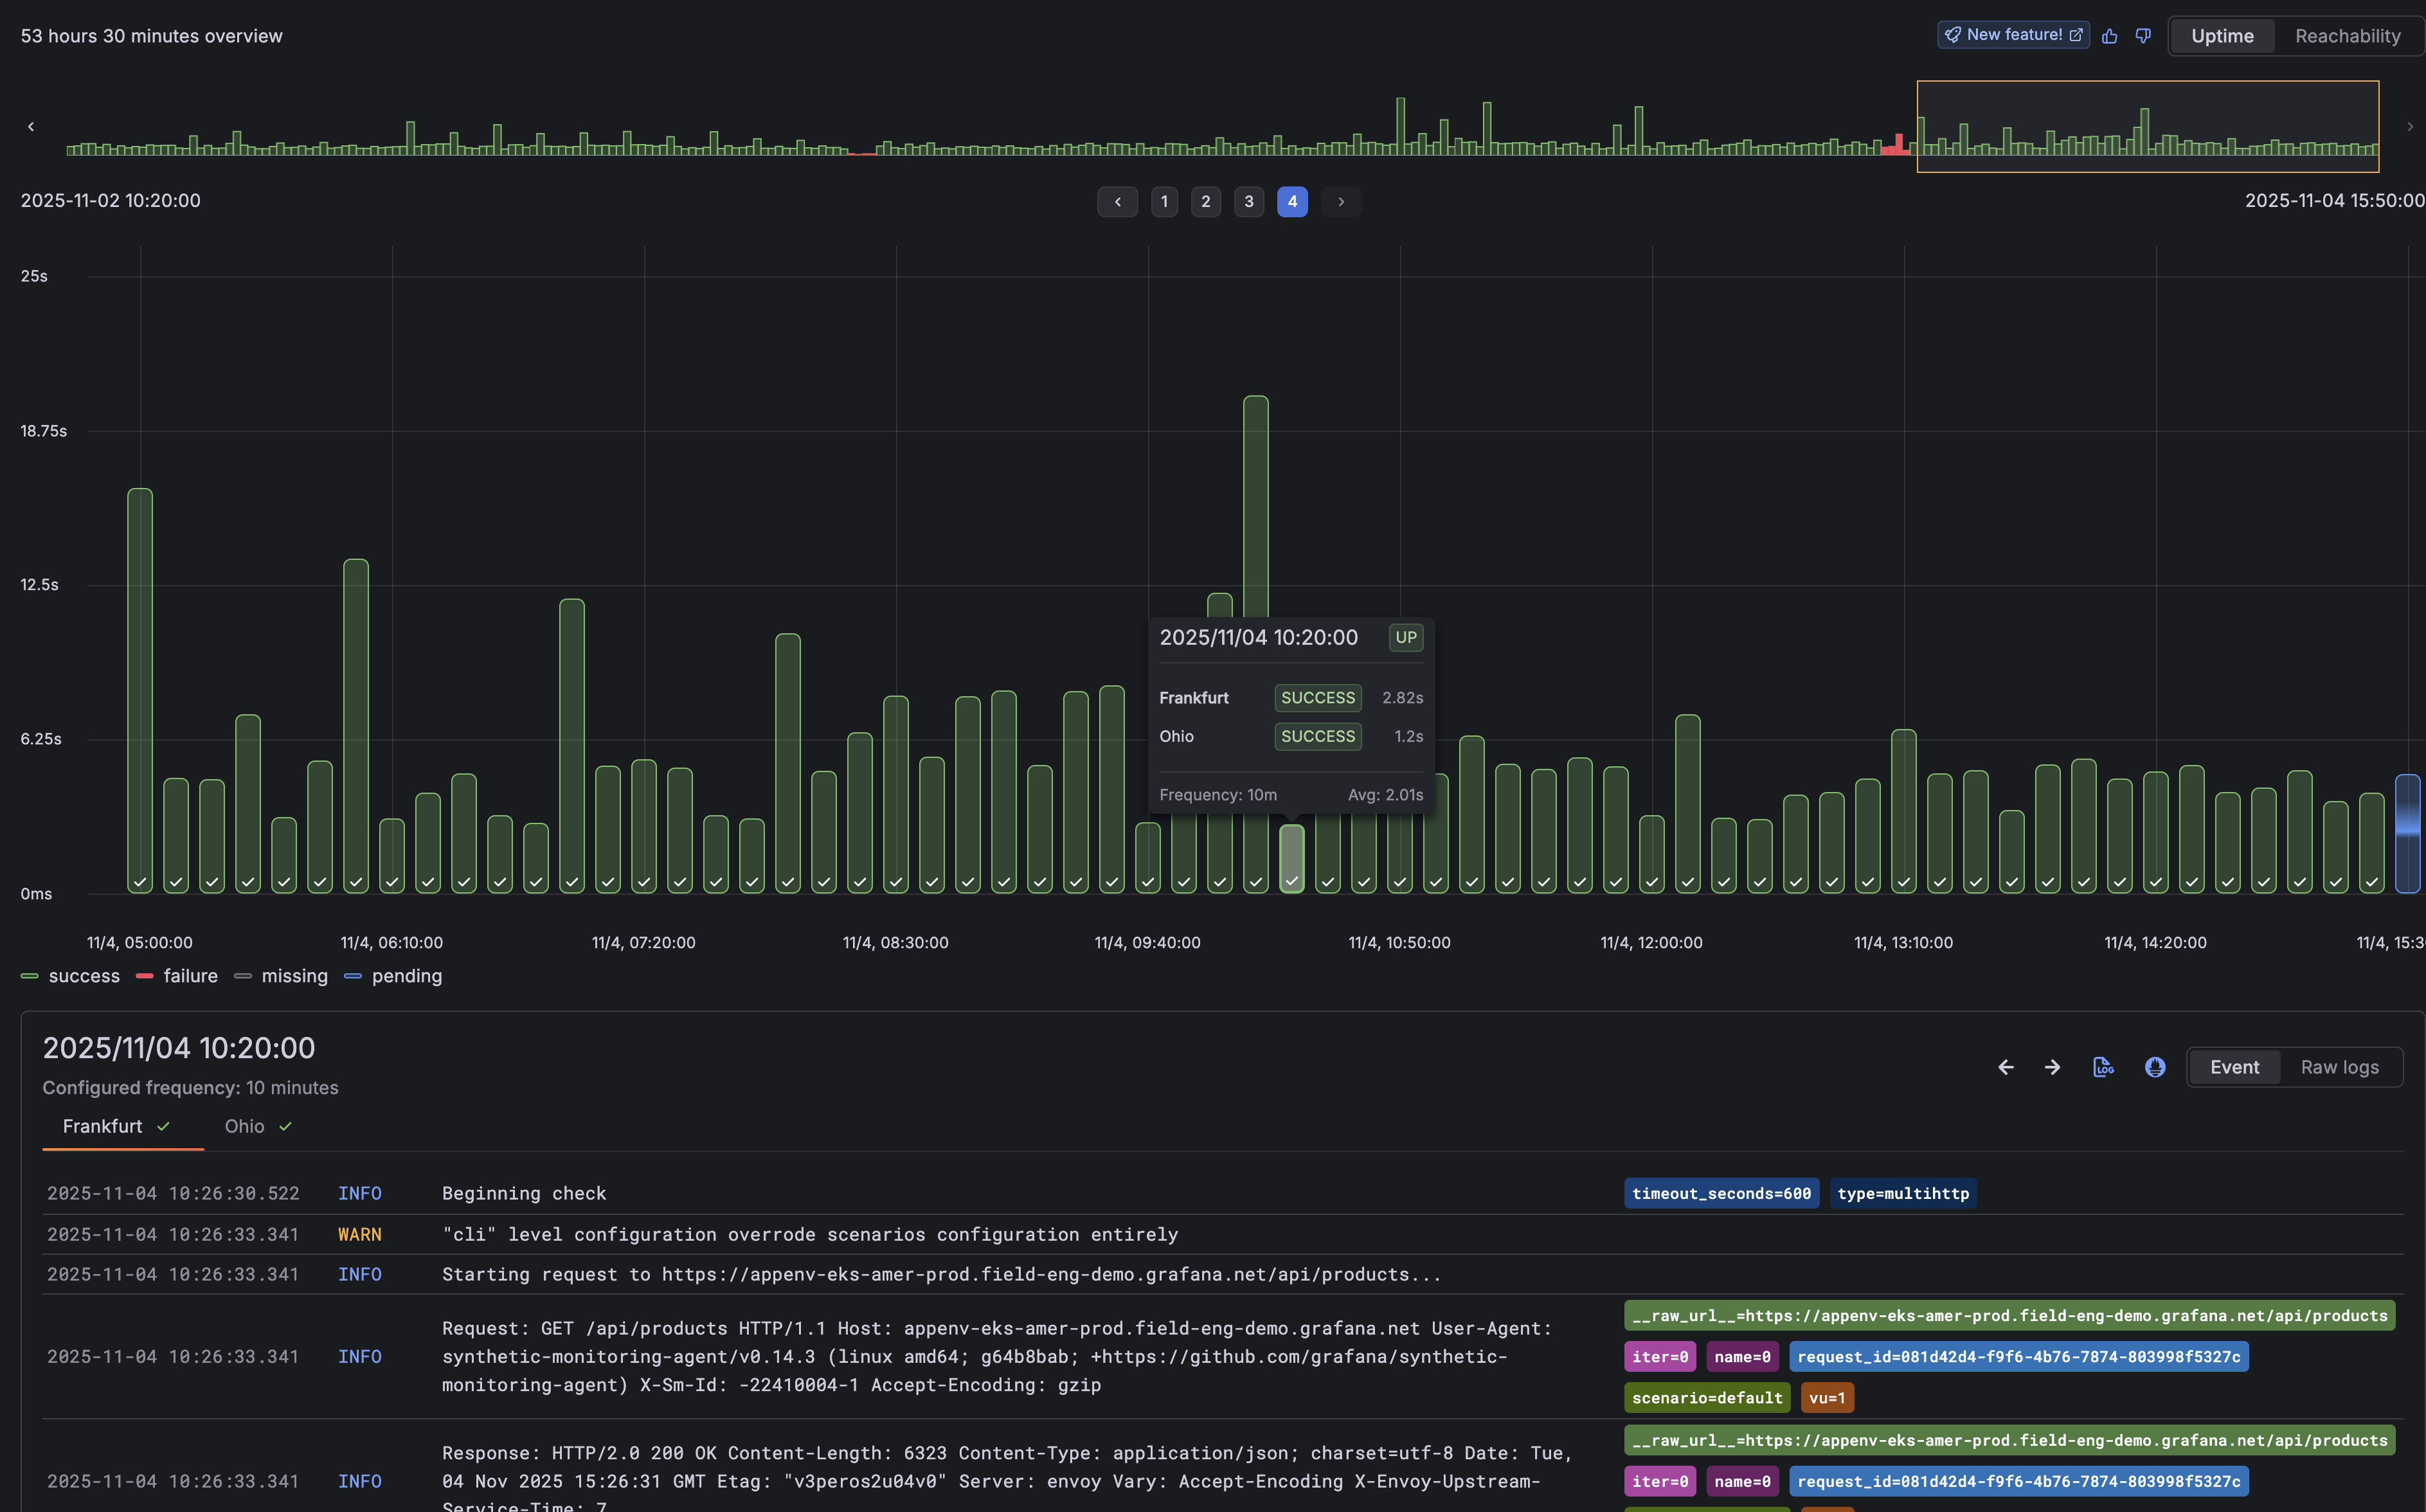
Timepoint Explorer visualizes every check execution as an individual event, turning results into a timeline you can explore. Each timepoint represents a probe execution, allowing you to pinpoint when failures happened and easily view the logs tied to those executions.
Explore uptime or reachability at a glance
Toggle between Uptime and Reachability views to investigate results from different perspectives:
Uptime view shows your overall service availability “Can any probes reach my service”
Reachability view breaks down results per probe location, helping you spot region-specific issues faster.
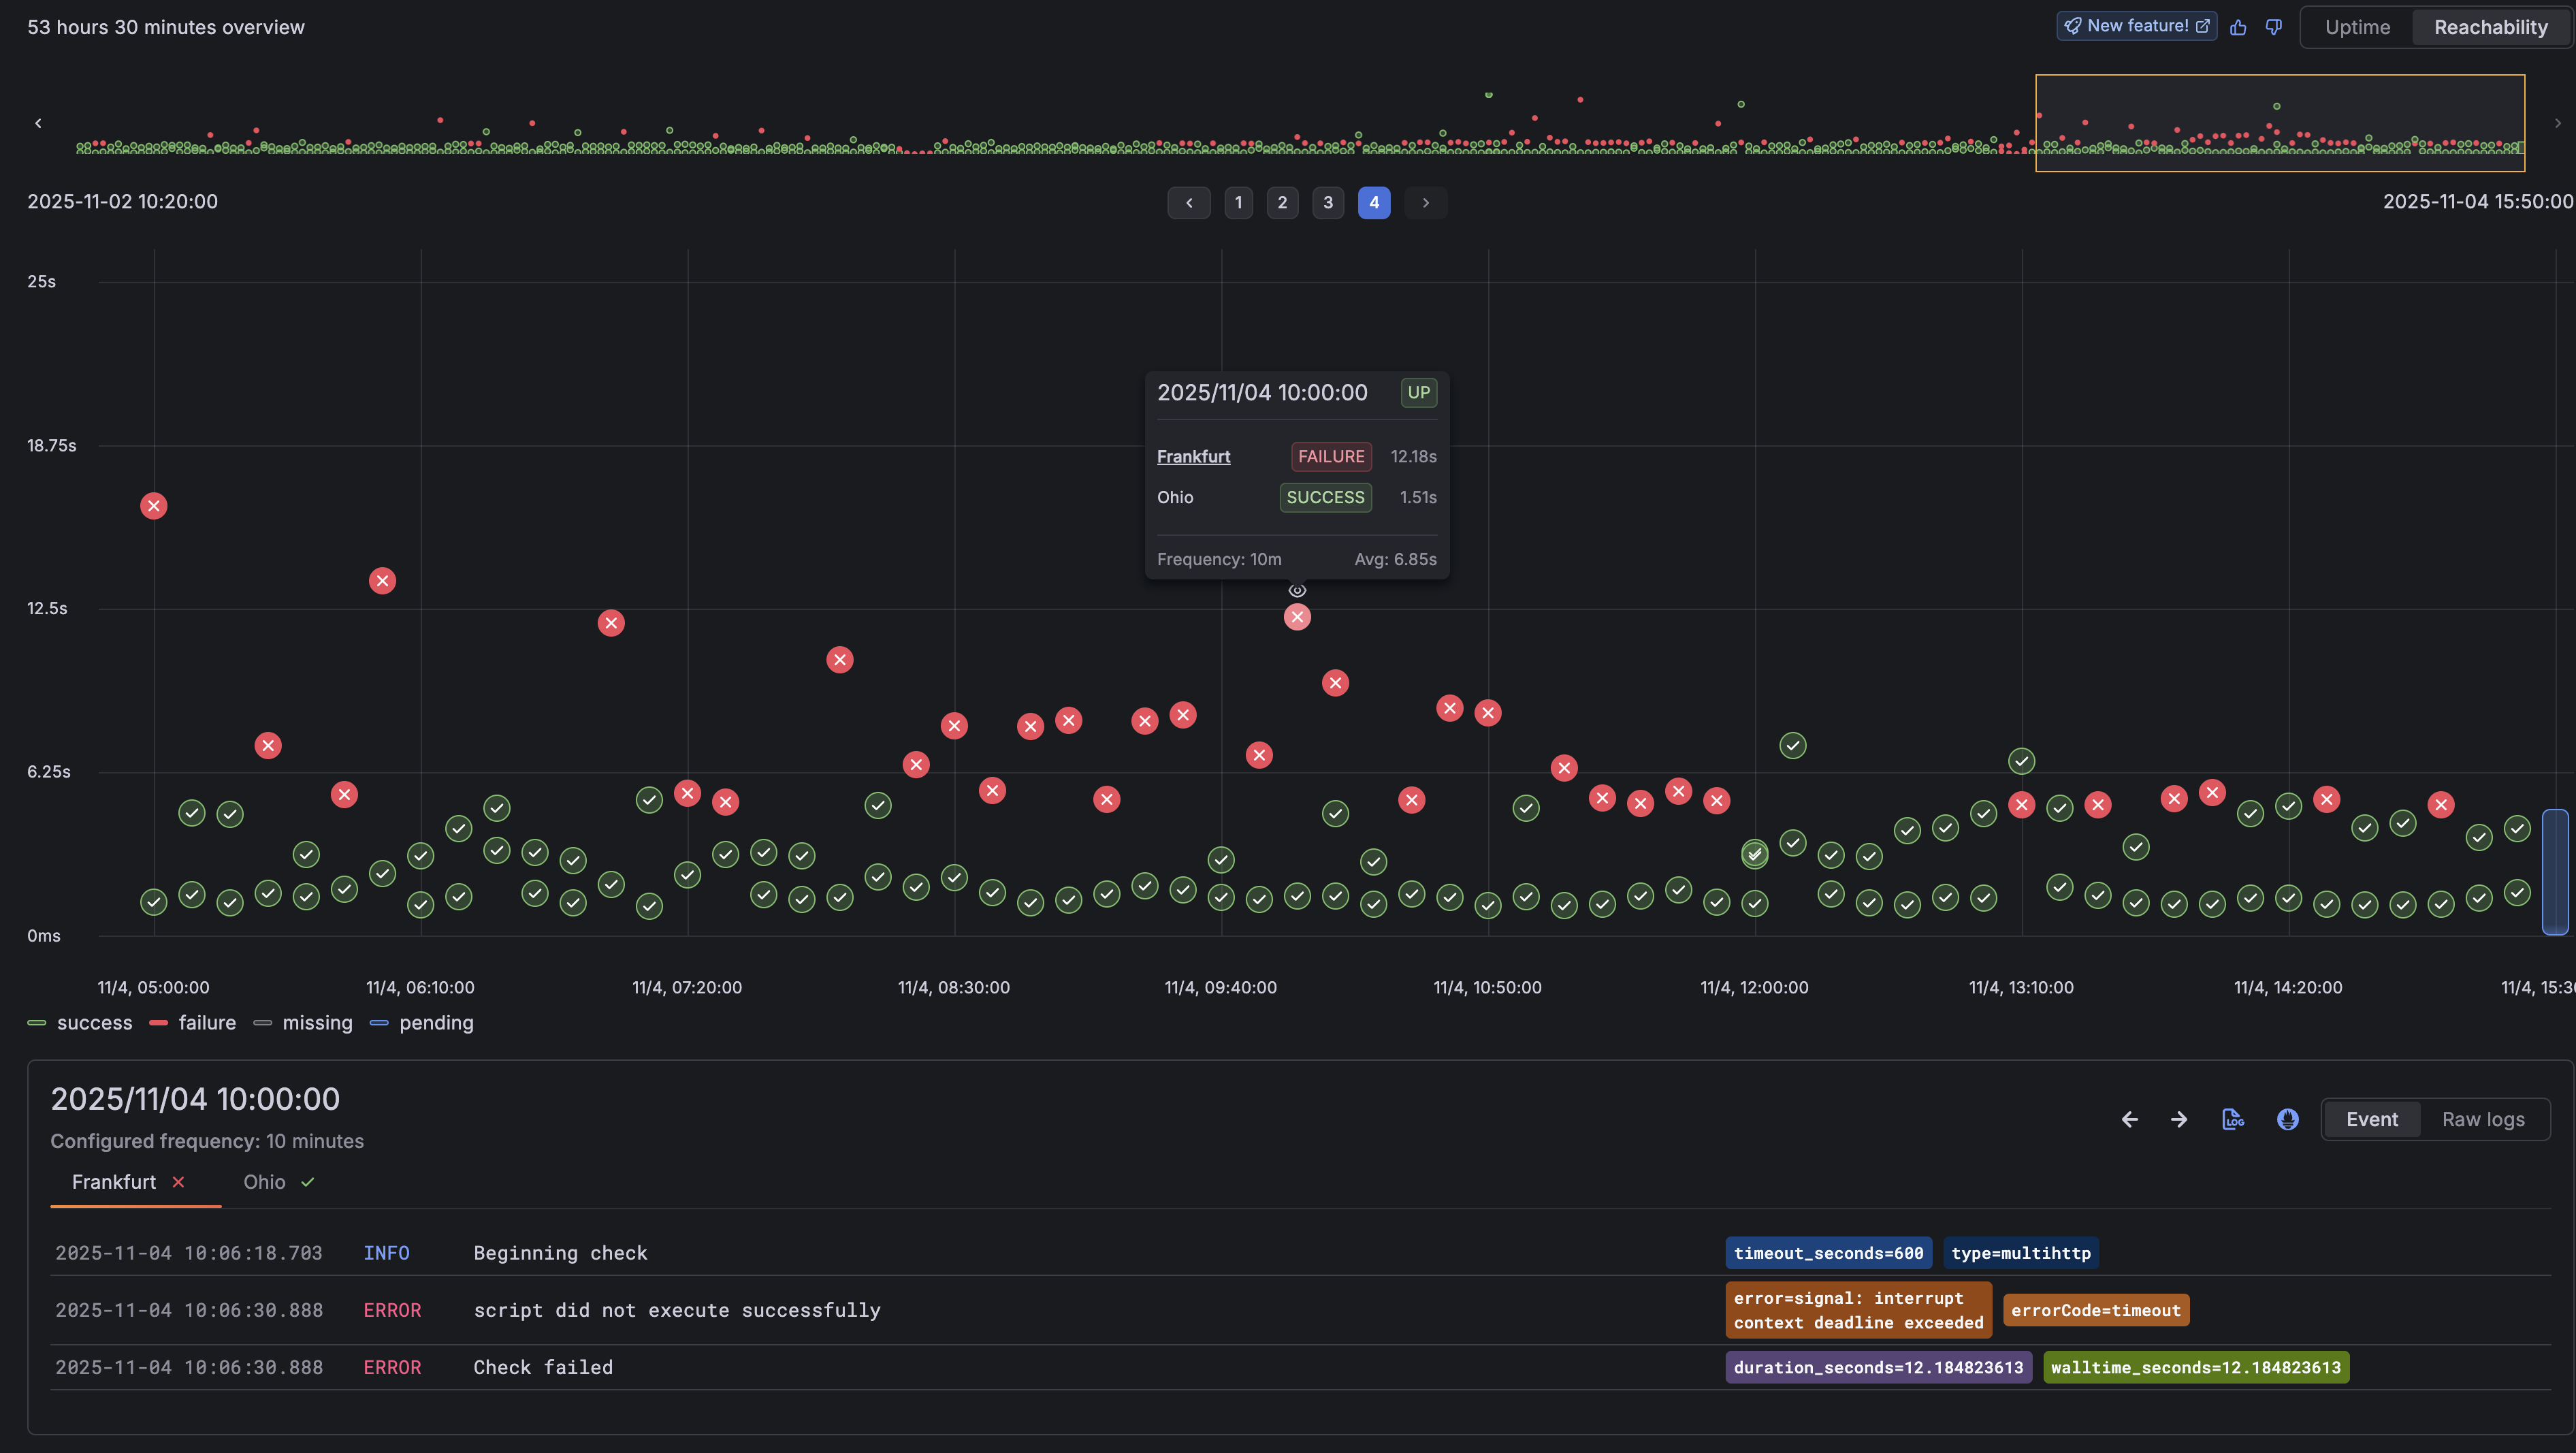
Together, these views make it easier to go from “Alert firing” to “what is failing” and investigating “why is it failing”.
Learn more about Analyzing Results in Synthetic Monitoring