What's new from Grafana Labs Synthetic Monitoring: Alert Routing Summary
What's new from Grafana Labs
Synthetic Monitoring: Alert Routing Summary
Understanding where your alerts are routed just got a whole lot easier.
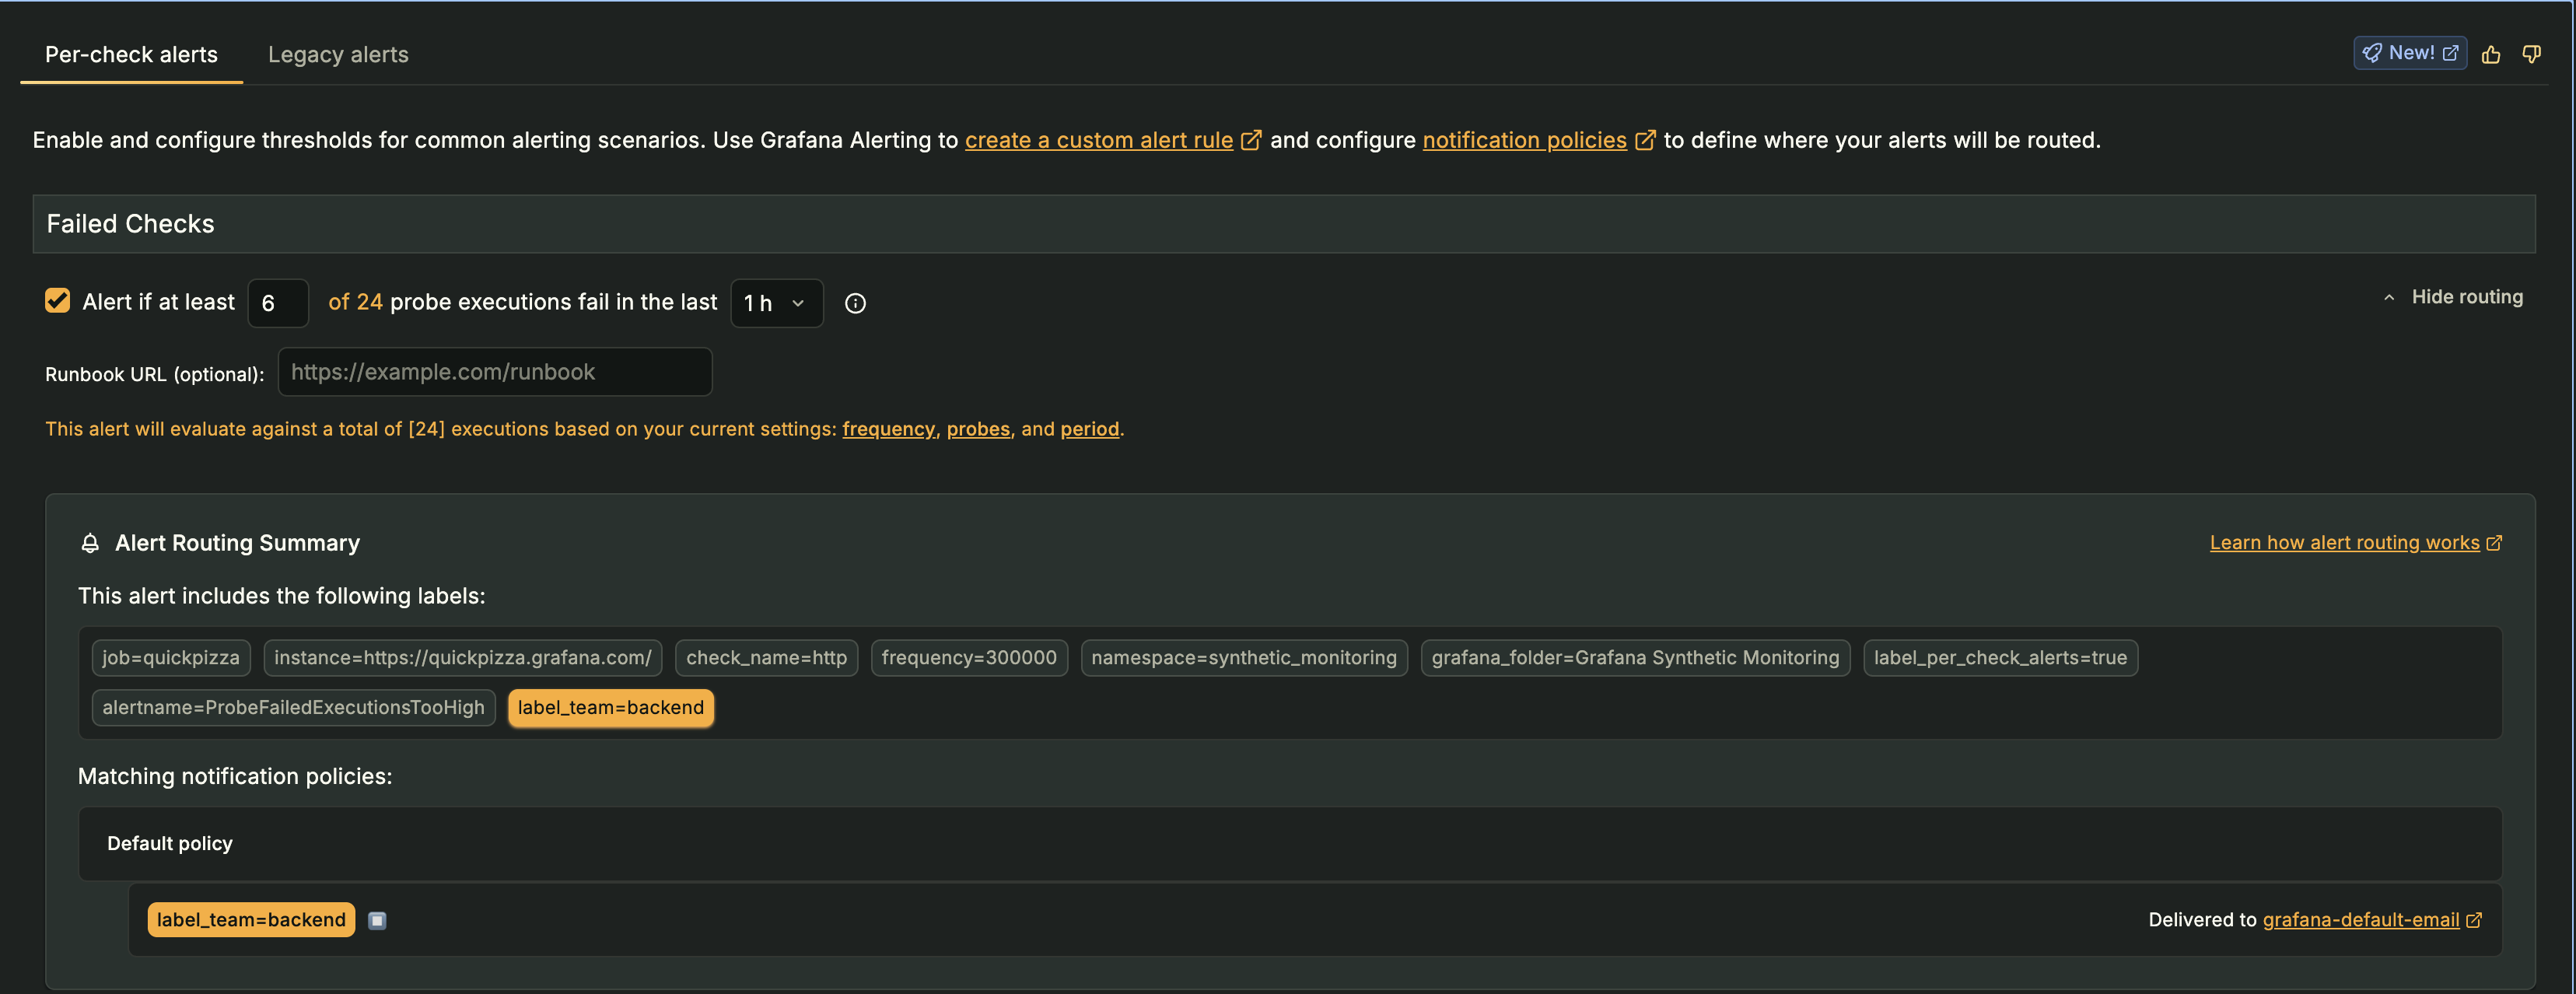
When configuring per-check alerts in Grafana Cloud Synthetic Monitoring, you can now see exactly which notification policies your alerts match, right from the UI.
The new Alert Routing Summary panel provides a clear, at-a-glance view of:
- The labels automatically included with your alert.
- Which notification policies those labels match.
- The destination contact points where alerts will be delivered.
In the example below, a check labeled label_team=backend matches a backend notification policy, making it clear that alerts will route to the correct destination.
This feature complements per-check alerts and makes it easier to understand, verify, and debug alert delivery.
Related What's new posts