
Consolidated panel time settings and time comparison
We’re excited to announce the addition of the Panel time settings drawer in visualizations. With this feature, you can access key panel-specific time settings without editing the dashboard:
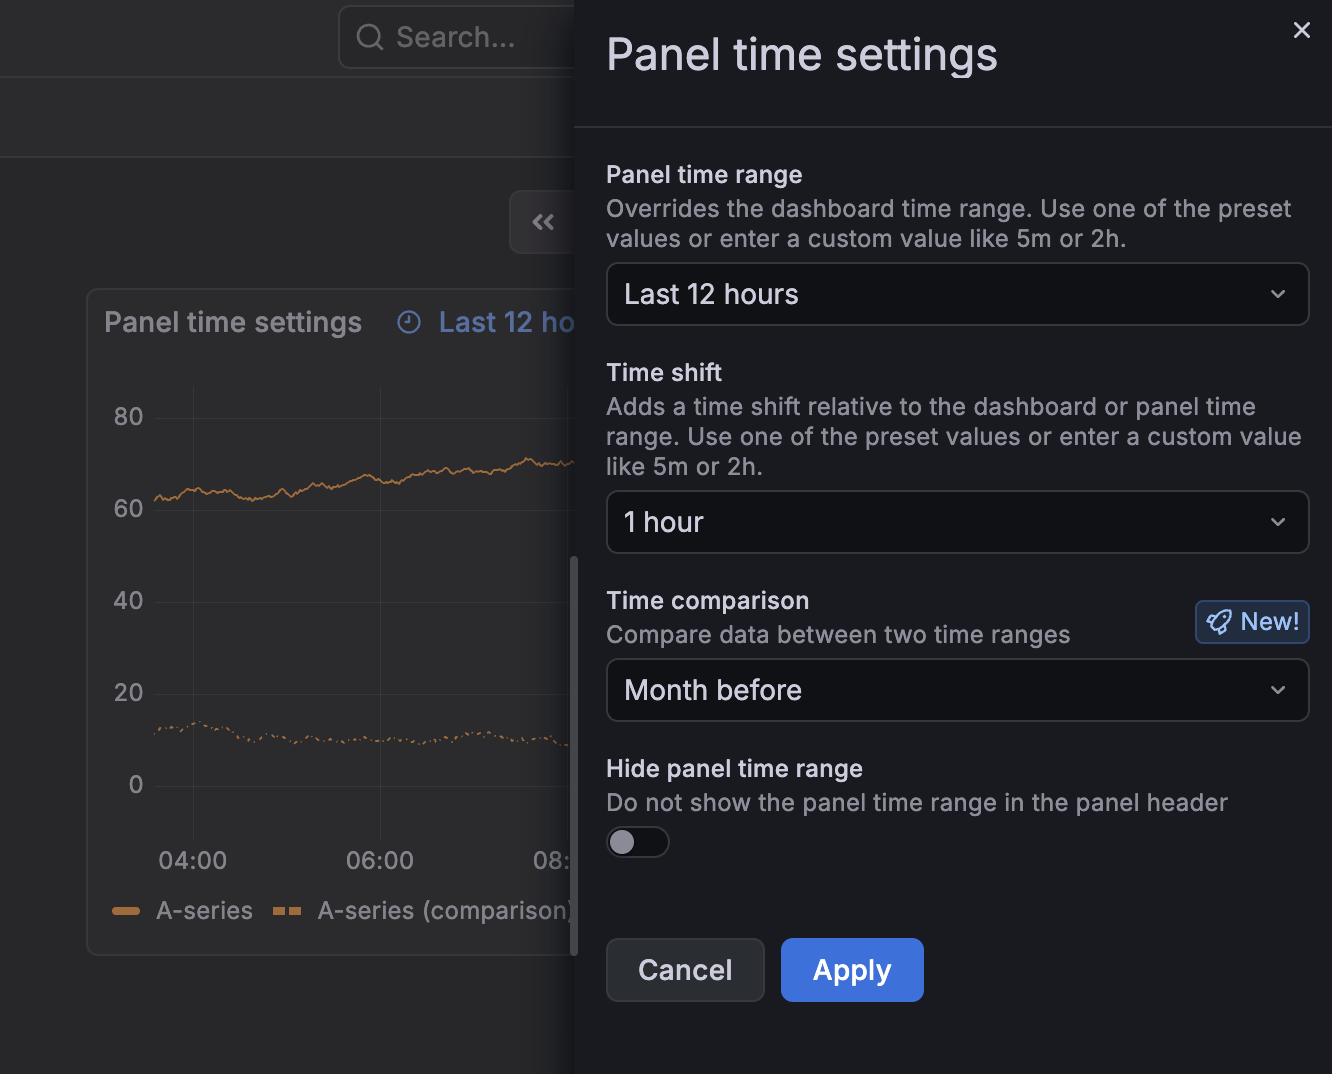
The settings available in the drawer are:
- Panel time range - Override the dashboard time range with one specific to the panel.
- Time shift - add a time shift in the panel relative to the dashboard time range or the panel time range, if you’ve set one.
- Time comparison - Compare time series data between two time ranges.
- Hide panel time range - Hide panel time range information in the panel header.
These time settings, when configured, are displayed in the panel header by default:

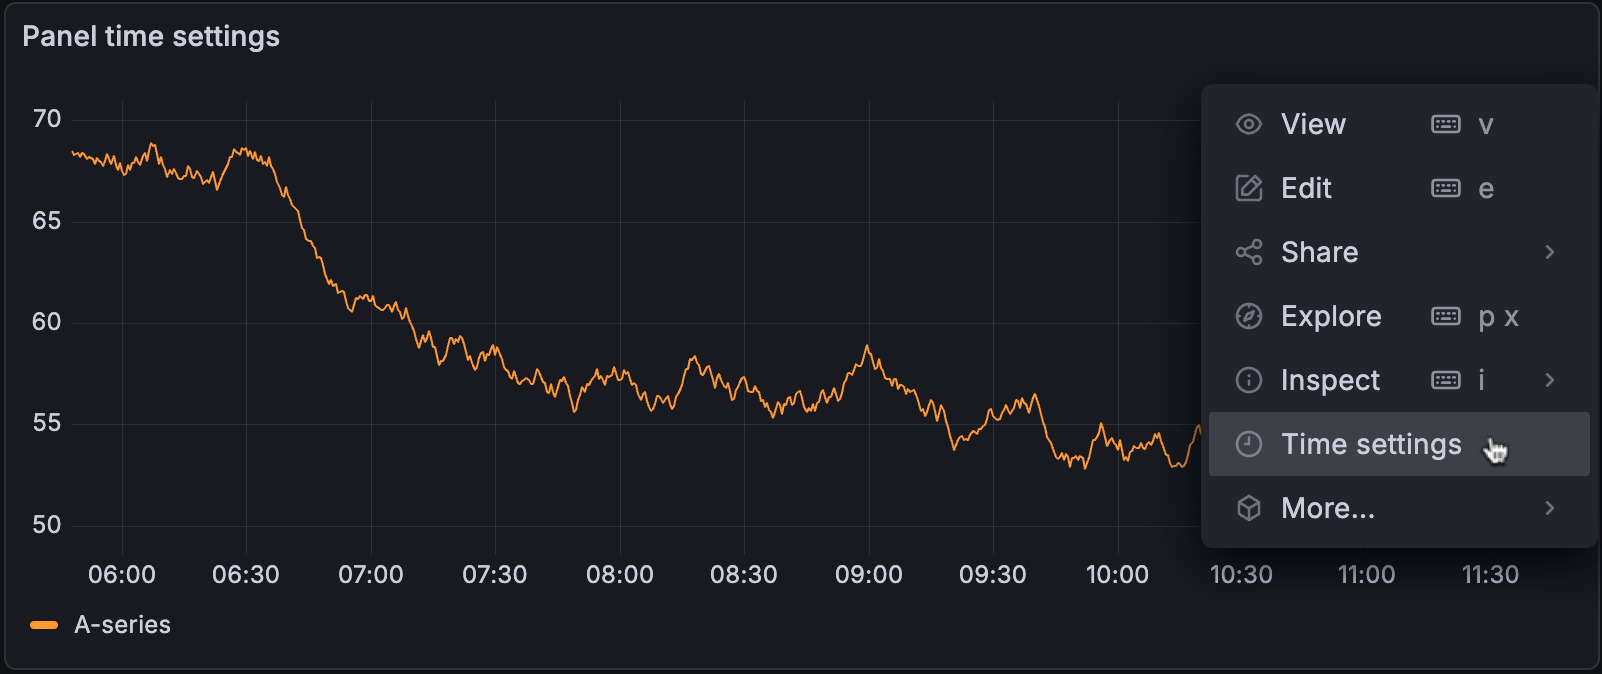
To access the Panel time settings drawer, click the panel menu and select the Time settings option:
To try out panel time settings, enable the panelTimeSettings and timeComparison feature toggles.
Time comparison
As part of this update, we’ve also added a much-requested feature, the ability to compare data between two time ranges in the same panel:
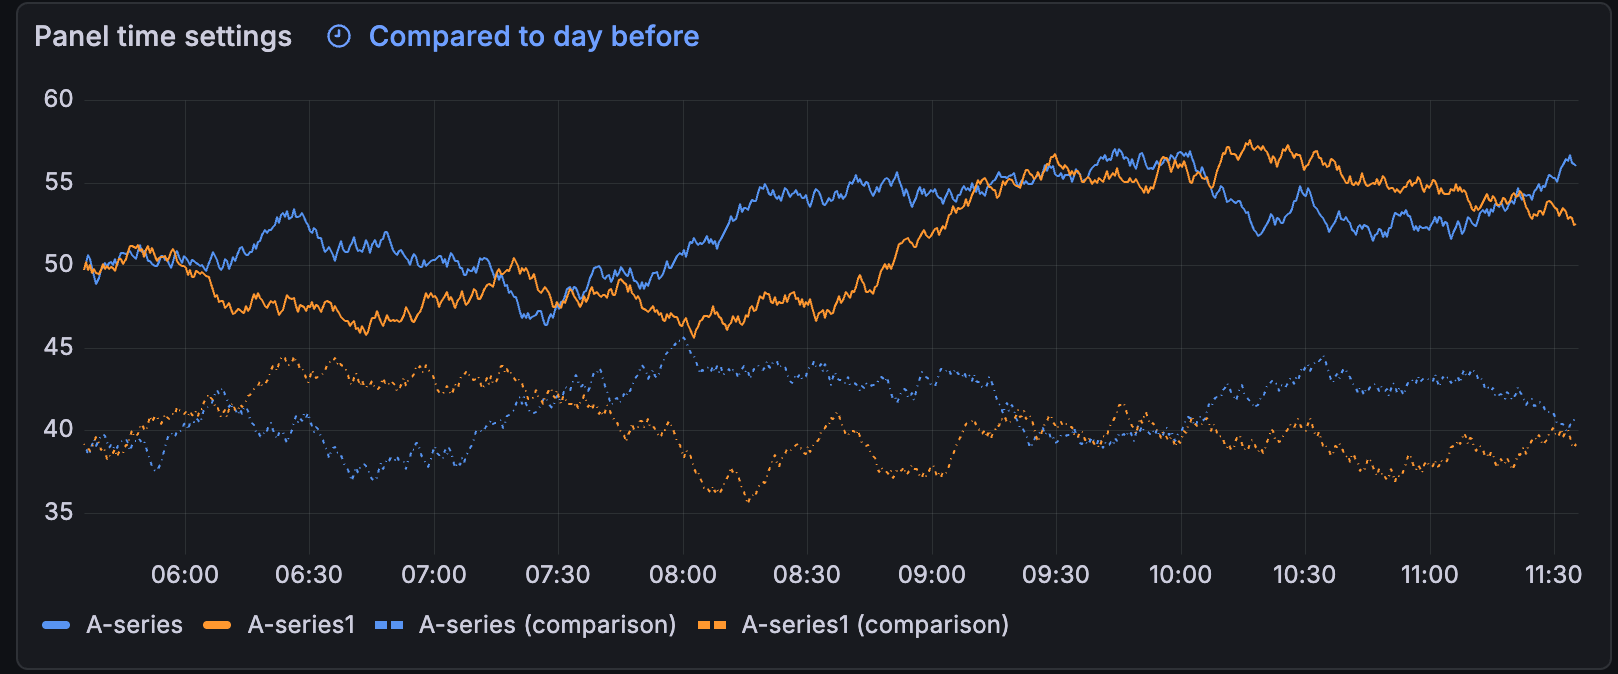
With this update, you can easily perform time-based (for example, month-over-month) comparative analyses in a single view, on the same panel. This allows you to gain insights essential for trend tracking and performance benchmarking. The addition of this feature has eliminated the need to duplicate panels or dashboards to achieve this type of analysis.