Dedicated Job Observability in Grafana Cloud Kubernetes Monitoring
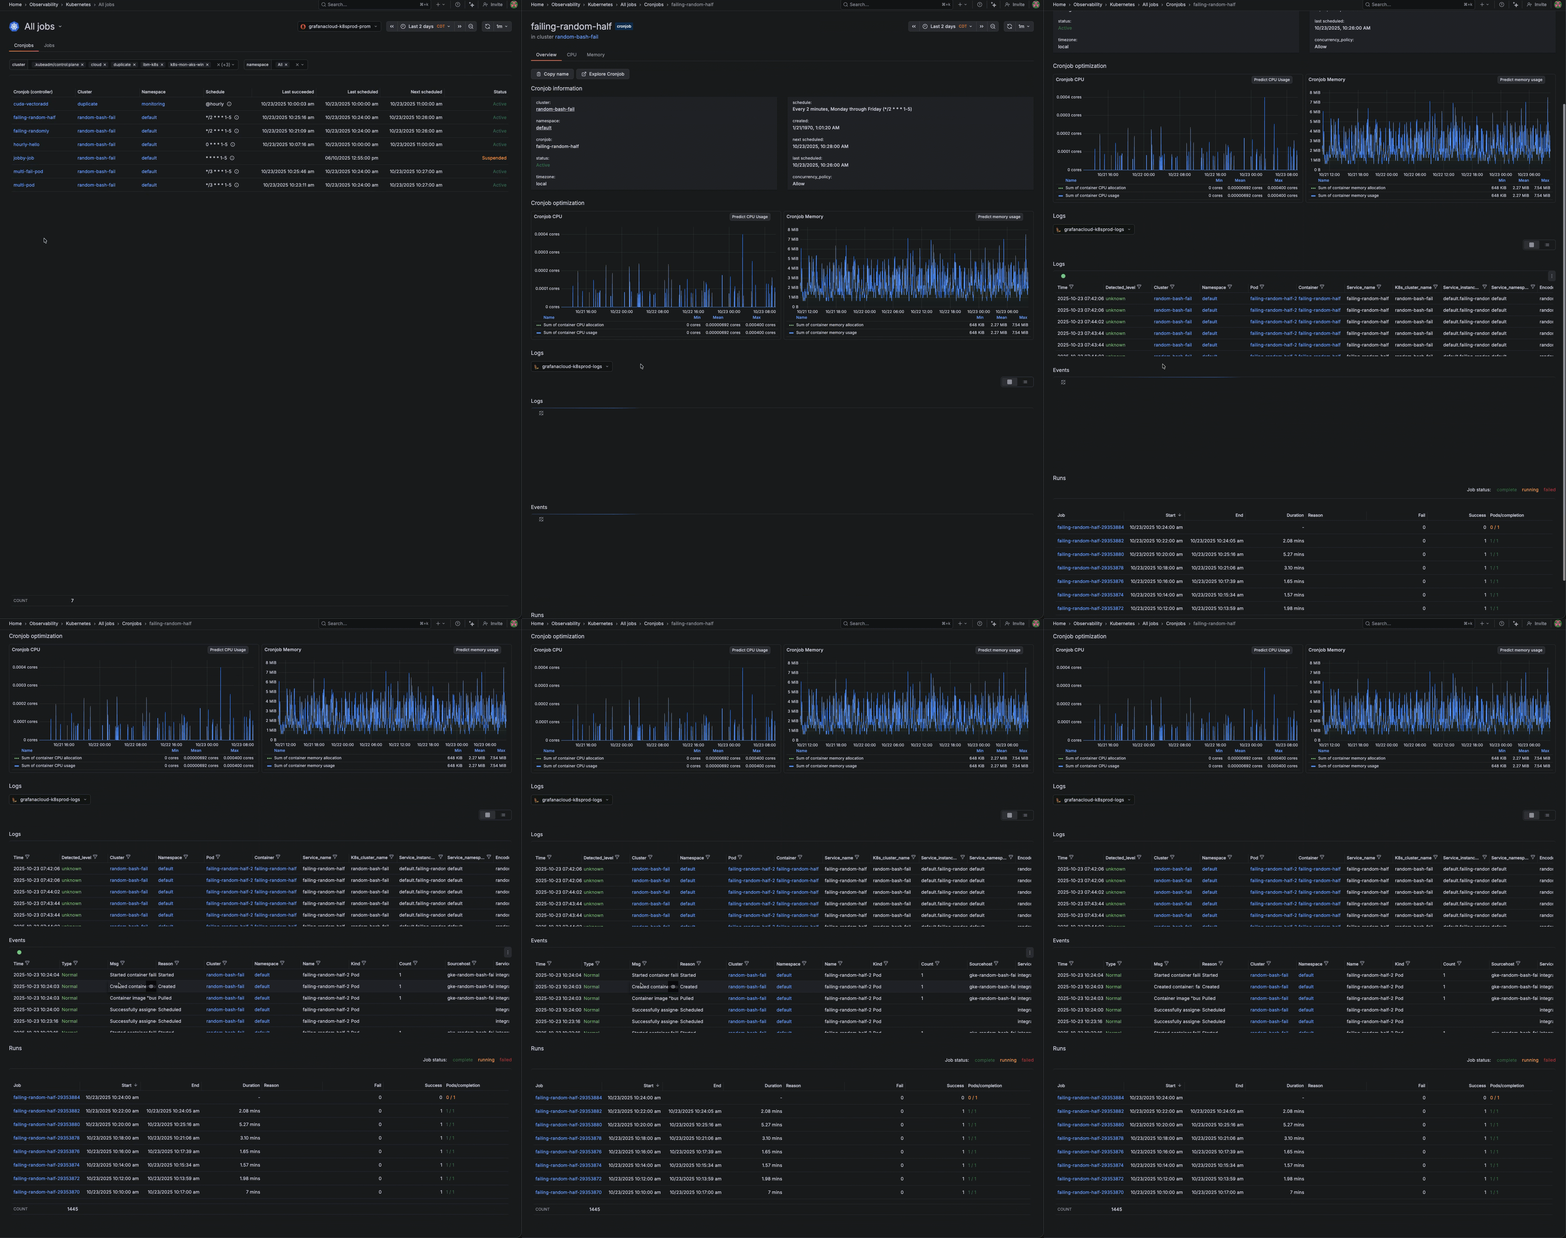
This dedicated feature set found under the All jobs menu solves the long-standing challenge of monitoring distributed Kubernetes Jobs and CronJobs, transforming the process from reactive firefighting to proactive management.
The Batch Visibility Gap
Managing critical Jobs and CronJobs across multiple Kubernetes clusters has historically been a source of operational friction, leading to:
- Undetected Failures: Missed execution windows and silent job failures that are only discovered hours later.
- Prolonged MTTR: Debugging requires manual, multi-command context-switching across different logs, metrics, and event streams.
- Inefficient Resource Use: Lack of historical resource data makes it difficult to right-size requests, leading to either wasted cloud spend or resource contention.
Key outcomes of the new Job Monitoring feature
This new feature delivers essential insights and consolidated diagnostic tools, ensuring the reliability and cost-efficiency of your scheduled tasks.
1. Guaranteed Execution Integrity
- Centralized Health View: The All jobs list provides a single source of truth across all Clusters and Namespaces, with color-coded status indicators for immediate failure detection.
- Punctuality Confirmed: For CronJobs, the feature explicitly compares Last scheduled against Last succeeded, instantly flagging any skipped runs or execution gaps that could impact data pipelines or maintenance routines.
2. Accelerated Diagnostics and Root Cause Analysis
- Consolidated Detail Page: Clicking a job name opens an integrated detail view, consolidating the Pod status, logs, and events—eliminating the need for manual kubectl commands.
- Pattern Identification: The historical Runs table tracks duration and success rates over time, enabling teams to spot flaky jobs, analyze trend data, and drastically reduce Mean Time to Resolution (MTTR).
3. Optimized Performance and Cost
- Resource Right-Sizing: Dedicated views for CPU and memory usage (including trends) facilitate precise resource provisioning. This data empowers you to identify wasteful over-provisioning and detect performance-impacting issues like gradual memory leaks.
Action: Access the new capabilities by navigating to the main menu and selecting All jobs within the Grafana Cloud Kubernetes Monitoring App.

