
New alerting options in Synthetic Monitoring
We’re excited to announce the general availability of new alerting capabilities for Synthetic Monitoring. These new capabilities are available to all Grafana Cloud users.
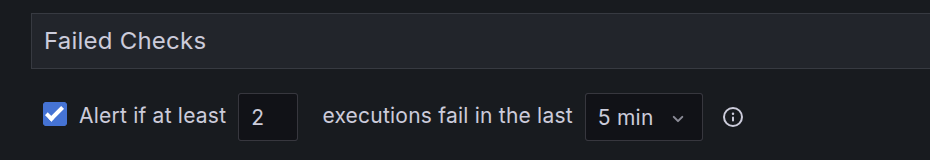
You can now create alerts for each check in your Synthetic Monitoring application. For example, you can create an alert based on the number of check failures in a specific time window, with different settings for each one of your checks.
Additionally, there are specific alerts available for certain check types:
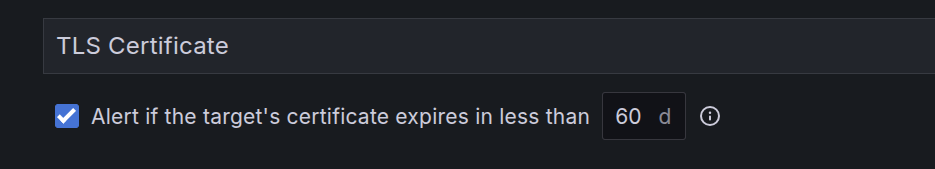
- For HTTP and TCP checks, you can create an alert if a TLS certificate is set to expire within a certain number of days.
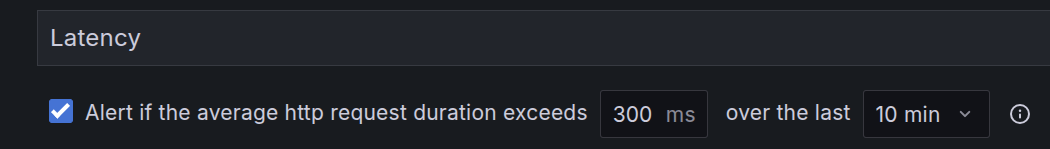
- And for HTTP, DNS, and Ping checks, you can create alerts based on latency.
The legacy alert rules based on sensitivity thresholds can still be used in combination with per-check alert rules.
Per-check alert rules give users more granular control over their alerting needs, making it easier for users to configure the right alert threshold depending on the services they’re monitoring and the check settings. These alerts are powered by Grafana Managed Alerts.
To learn more, refer to the per-check alerts docs.