Spot patterns in your data with the Trendline transformation
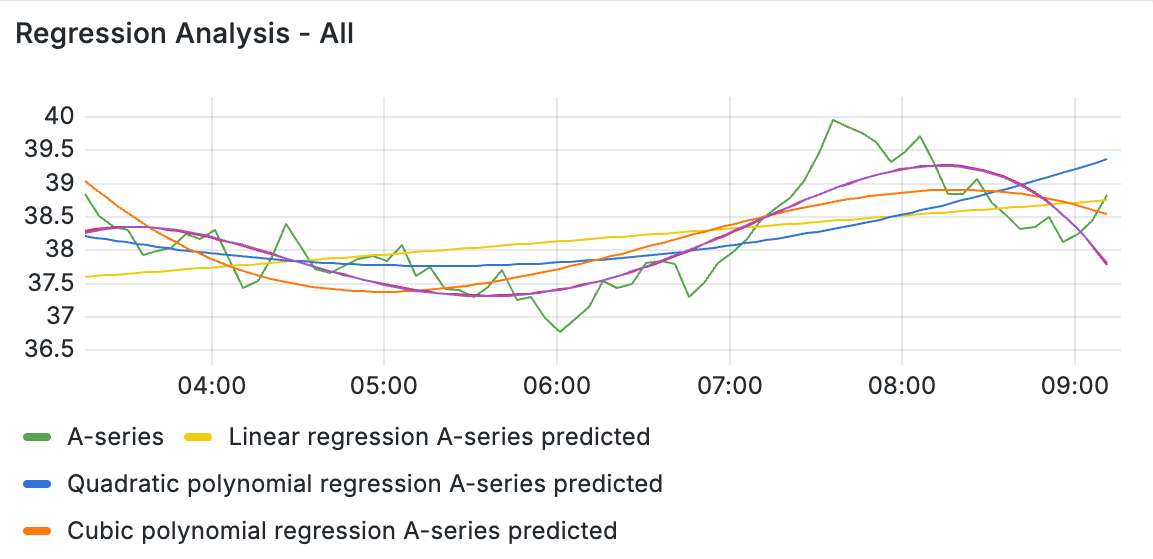
Apply this transformation to any dataset to add a trendline as a new series, fitted to your data using linear regression. This allows you to infer what the data was at a point that may not be exactly represented in the original dataset, or plot predicted values in the future. Trendlines are great for spotting patterns in fluctuating or inconsistent time series. This transformation is extra useful because trendlines can be styled and used just like any other series in your visualization. The Trendline transformation supports both linear and polynomial regression models.
See examples of this transformation on Grafana Play.

