
What's new from Grafana Labs HTTP Performance Insights
What's new from Grafana Labs
HTTP Performance Insights
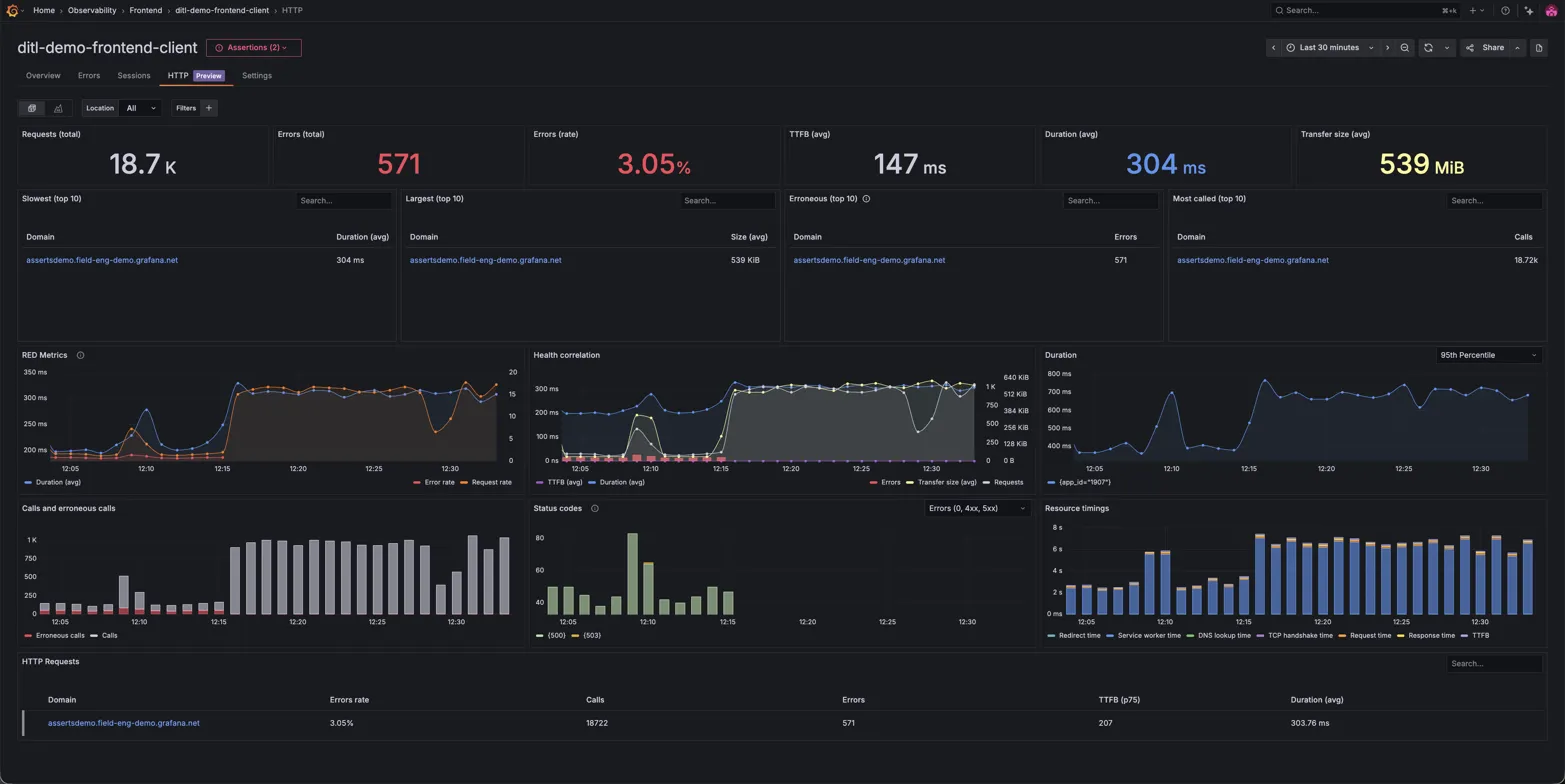
You can now visualize HTTP Performance Insights in Grafana Cloud Frontend Observability. This feature provides a unified view of your slowest endpoints, largest requests, and most error-prone calls, helping you quickly identify and resolve application performance issues.
No more hunting through scattered logs or custom dashboards. These views and breakdowns help you discover insights and gauge impact. You can understand:
- Which API endpoints or assets are causing slowdowns or errors?
- How widespread is a specific performance issue?
- What are the biggest opportunities for optimization based on how issues occur over time.
To get started, log in to your Grafana Cloud Frontend Observability application and navigate to the new HTTP tab. Your real user HTTP data is automatically available for you. No extra setup required. For more information visit our documentation.
Related What's new posts