
What's new from Grafana Labs Server-configurable quick time ranges for dashboards
What's new from Grafana Labs
Server-configurable quick time ranges for dashboards
Grafana server administrators can now define custom time range presets for the time picker on dashboards — perfect for teams that routinely analyze specific, context-driven time windows.
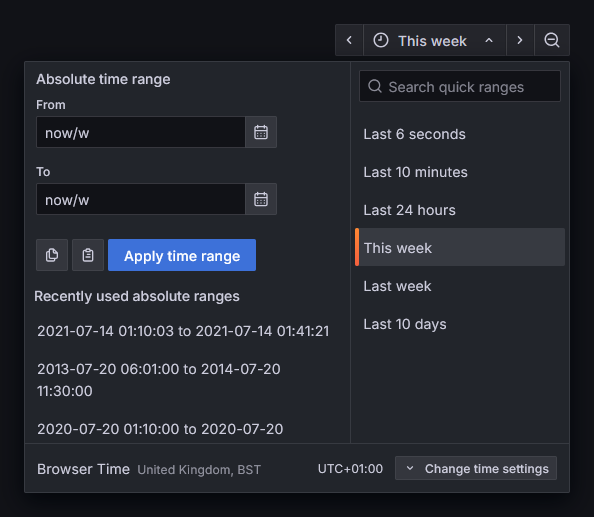
By configuring [time_picker] quick_ranges in your server config, you can set server-wide defaults specific to the data you are monitoring:
[time_picker]
quick_ranges = """[
{"from":"now-6s","to":"now","display":"Last 6 seconds"},
{"from":"now-10m","to":"now","display":"Last 10 minutes"},
{"from":"now-25h","to":"now","display":"Last 24 hours"},
{"from":"now/w","to":"now/w","display":"This week"},
{"from":"now-1w/w","to":"now-1w/w","display":"Last week"}
]"""
Thanks to Chris Hodges for contributing this feature!
Related What's new posts