Monitoring and visualization solutions
Monitoring and visualization solutions / Jira / Visualize Jira
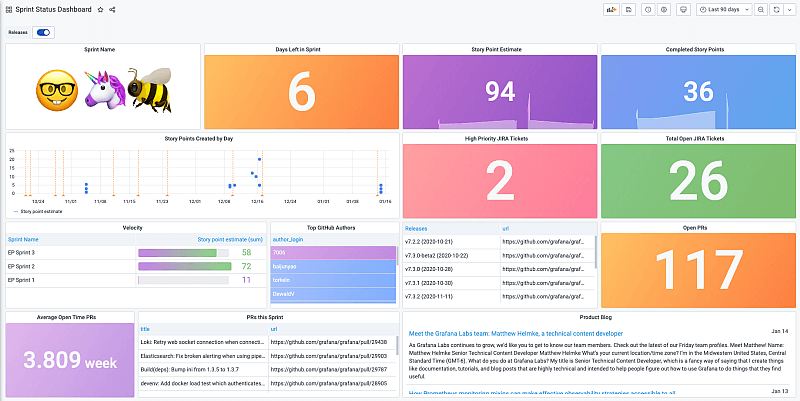
Visualize Jira easily with Grafana
With the Grafana Enterprise plugin for Jira, the popular software development tool for collaboration and planning, you can quickly visualize issue data from Jira alongside application performance data from other sources to get the whole picture of your development process.
How to configure the JIRA plugin
Get started with these easy steps
1
Get started with these easy steps
1
Get started with these easy steps
1
2
3
That’s it! You’ll immediately see pre-built Grafana dashboards and alerts tailored for Jira.
Get started with these easy steps
1
That’s it! You’ll immediately see pre-built Grafana dashboards and alerts tailored for Jira.
Get started with these easy steps
1
2
3
That’s it! You’ll immediately see pre-built Grafana dashboards and alerts tailored for Jira.
Get started with these easy steps
1
2
3
That’s it! You’ll immediately see pre-built Grafana dashboards and alerts tailored for Jira.
Get started with these easy steps
1
That’s it! You’ll immediately see pre-built Grafana dashboards and alerts tailored for Jira.
Get started with these easy steps
1
2
3
That’s it! You’ll immediately see pre-built Grafana dashboards and alerts tailored for Jira.
Get started with these easy steps
1
That’s it! You’ll immediately see pre-built Grafana dashboards and alerts tailored for Jira.
Get started with these easy steps
1
2
3
That’s it! You’ll immediately see pre-built Grafana dashboards and alerts tailored for Jira.