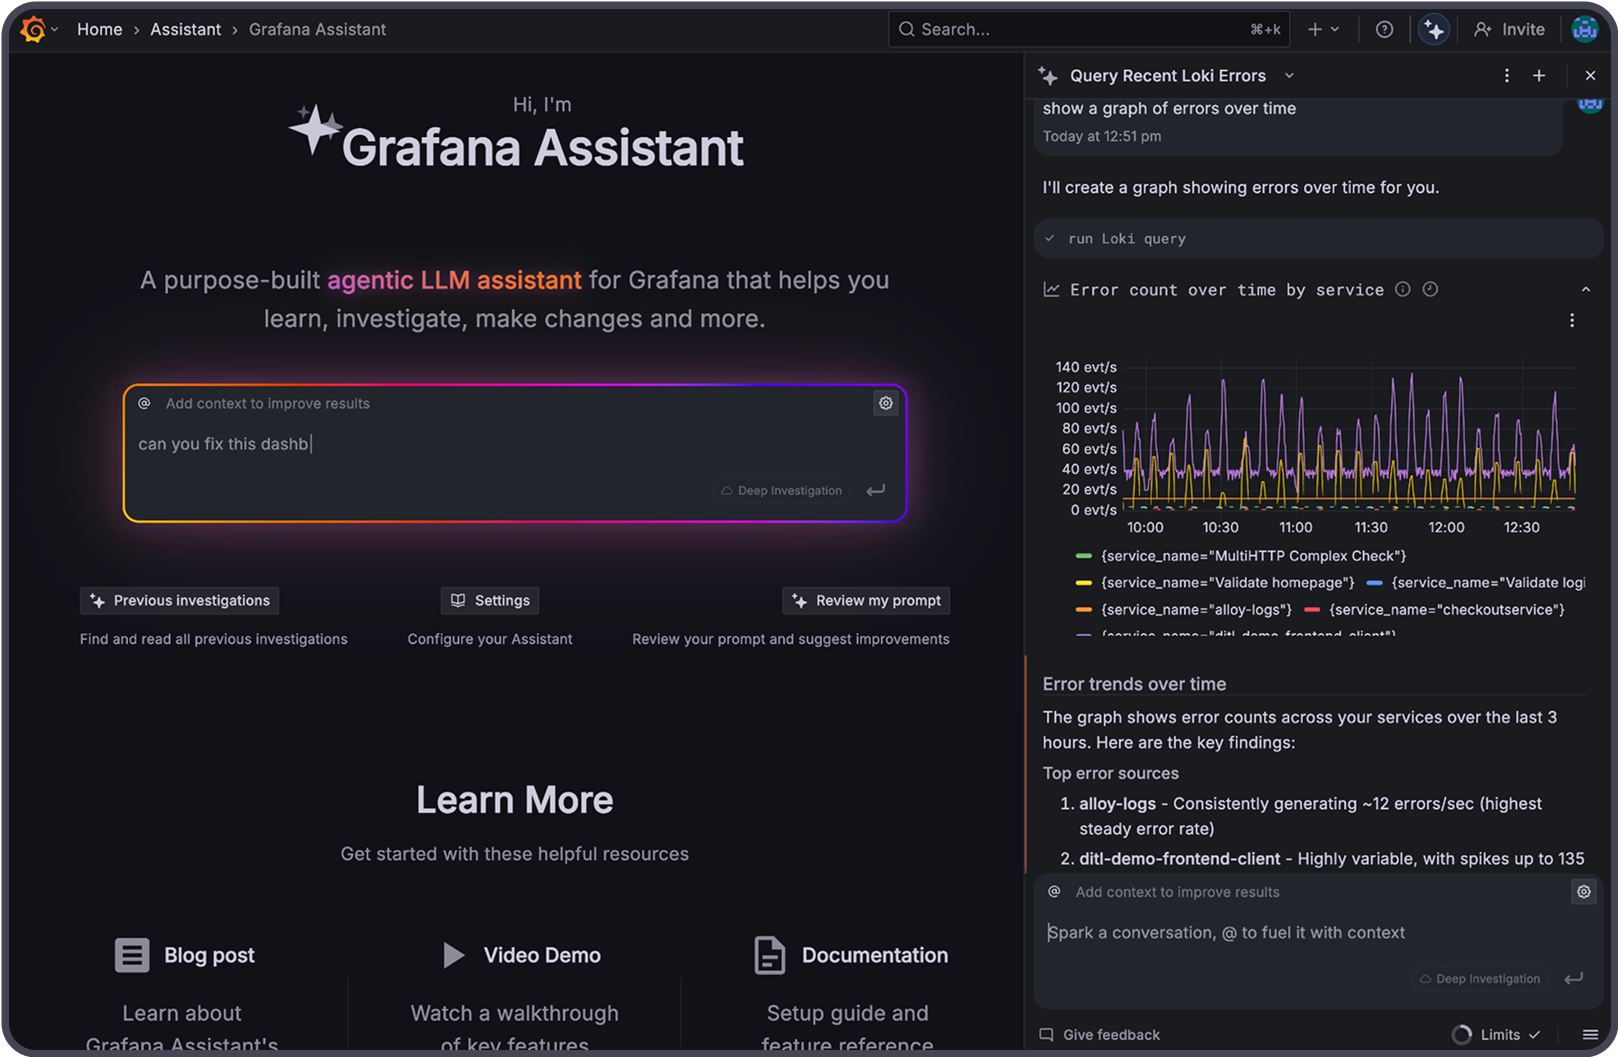
One assistant. Your entire stack.

- 50GB logs
- 50GB profiles
- 50GB traces
- 10k metrics
- 3 active users
- 14-day retention
Work smarter, not harder
Automate routine tasks like incident summaries and checks so teams can focus on higher-impact work.
Solve faster
Accelerate investigations with built-in agents that surface signals and guide teams before issues escalate.
Spend better
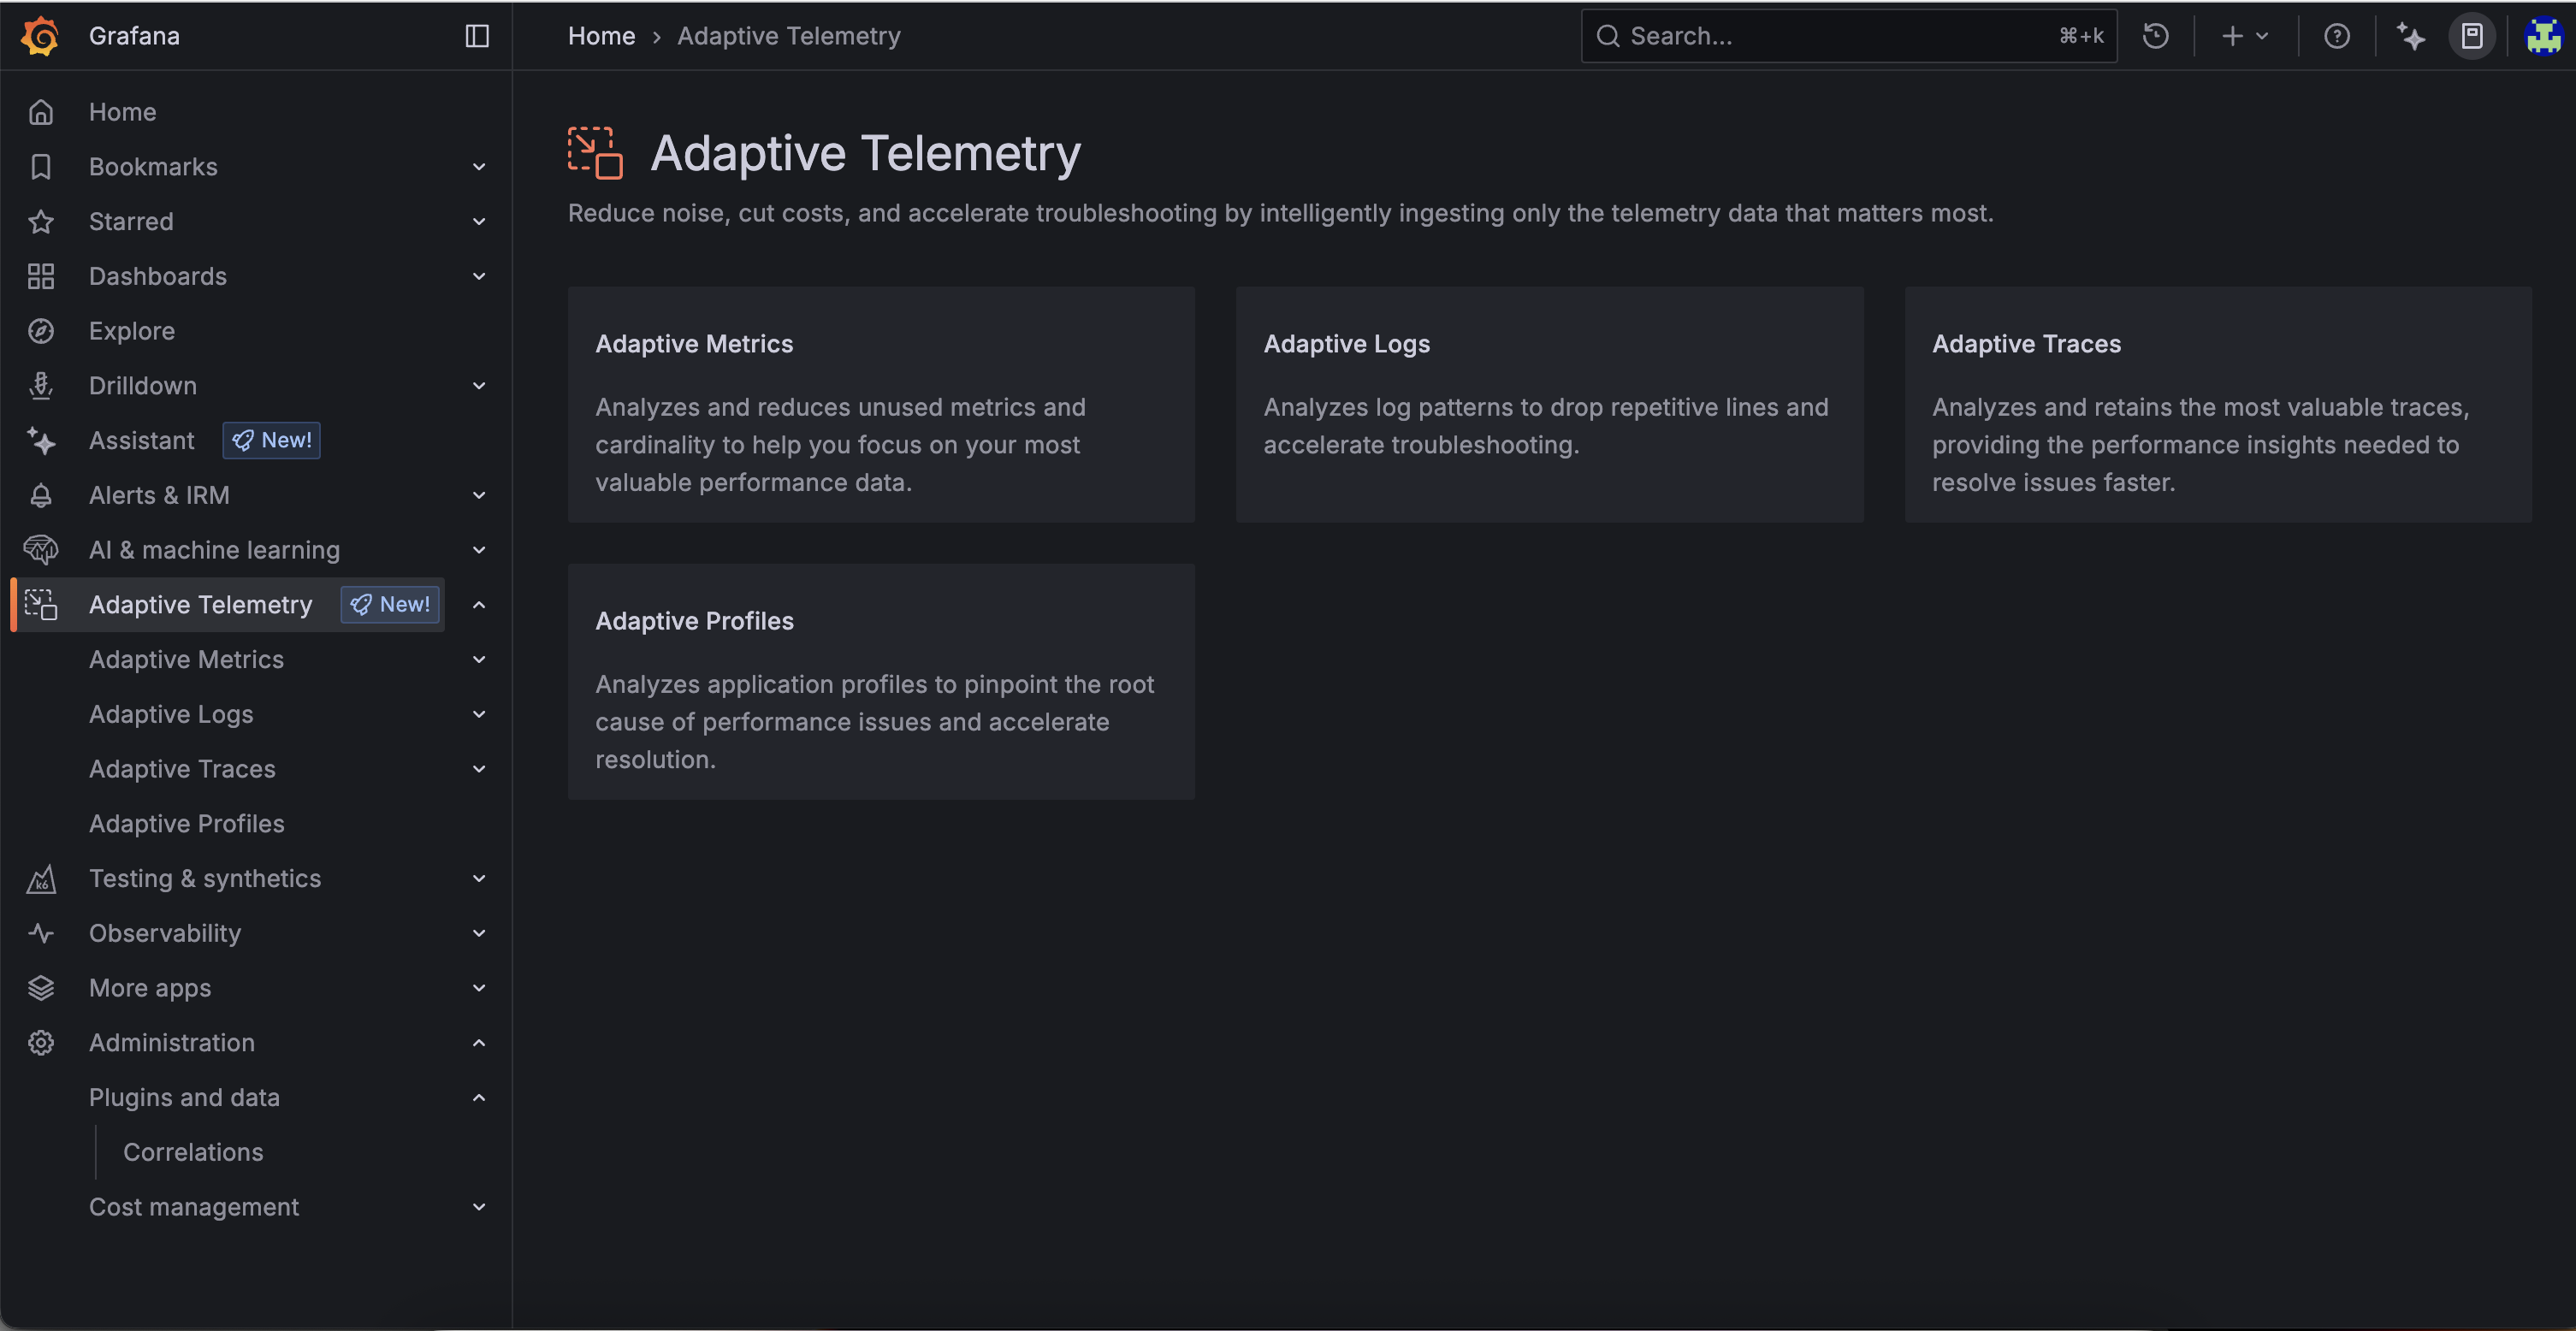
Control costs, amplify key signals, and cut waste with Adaptive Telemetry.
Unlock observability as easy as chat
AI in Grafana Cloud
Grafana Cloud delivers a rich set of agents across your observability workflow, enabling self-service for every team. The result: faster insights, lower costs, and less friction across your organization.
Start faster
- Onboard in minutes with chat-driven workflows
- Get step-by-step guidance with AI-assisted support
- Use natural language to write queries and build dashboards

Cut spend while amplifying signal
- Optimize storage and retention without manual tuning — customers report 35–50% cost reductions across metrics, logs, and traces
- Preview and set policies in the UI, with one-click protection for must-keep telemetry
Find root cause faster with agentic investigations
- Accelerate investigations with the SRE agent (Assistant Investigations)
- Connect signals seamlessly through a knowledge graph for richer RCA
- Generate instant log and error explanations to speed triage

Operate services more reliably with AI assistance
- Improve dashboard hygiene with AI-generated titles and descriptions
- Make profile data actionable with AI-assisted flame graph parsing
- Maintain enterprise security with role-based access controls for investigations, rules, and MCP server management
AI observability
As AI applications grow more complex, Grafana Cloud makes it easier to track costs and performance of AI workloads with prebuilt dashboards and alerts.
Observe and optimize your AI apps in real time
- Monitor Claude usage and costs with a prebuilt integration and dashboards with the Anthropic integration
- Gain visibility into prompts, completions, and model performance in production
- Track infrastructure health across vector DB performance, GPUs, and per-model trends

AI in Grafana OSS
Grafana Cloud remains the fastest path to value, but OSS innovation ensures flexibility for everyone. With our open source LLM plugin and MCP server, you can connect agents to Grafana and extend AI where you need it — all without lock-in.
Extend AI across your stack with open integrations
- MCP support: Connect agentic tools to other data for richer context
- OSS LLM plugin: Centralize keys, choose providers, and add “explain this” features across Grafana
Our approach: Built-in AI that works the way you do
AI is everywhere—but we’re focused on making it practical. Our goal is simple: AI that’s seamless, useful, and built into the workflows you already use in Grafana Cloud.
With tools like Assistant and Assistant Investigations, AI becomes a natural part of your observability journey. It works alongside you in real time, responds to your hints, and keeps you in control—so your team can move from data to action faster.
Because we use these tools ourselves, we’ve designed them with flexibility in mind. Integrations with Slack and MCP servers help you get work done wherever you are.
Read our blog post to learn more about how we’re building AI into observability
Access AI tools in Grafana Cloud
Additional resources
Frequently asked questions
Grafana Cloud’s AI features support engineers and operators throughout the observability lifecycle — from detection and triage to explanation and resolution. We focus on explainable, assistive AI that enhances your workflow.
AI in observability applies AI to operate your systems better and refers to the use of AI as part of a larger observability strategy. This could include agents baked into a platform (e.g., Grafana Assistant in Grafana Cloud) or other integrations that help automate and accelerate the ways teams observe their systems.
AI observability is the use of observability to track the state of an AI system, such as an LLM-based application. It’s a subset of observability focused on a specific use case, similar to database observability for databases or application observability for applications.
Grafana Cloud does both: AI that helps you operate, and observability for your AI.
We build around:
Human-in-the-loop interaction for trust and transparency
Outcome-first experiences that focus on real user value
Multi-signal support, including correlating data across metrics, logs, traces, and profiles
By default, Grafana OSS doesn’t include built-in AI features found in Grafana Cloud, but you can enable AI-powered workflows using the LLM app plugin. This open source plugin connects to providers like OpenAI or Azure OpenAI securely, allowing you to generate queries, explore dashboards, and interact with Grafana using natural language. It also provides a MCP (Model Context Protocol) server, which allows you to grant your favourite AI application access to your Grafana instance.
Grafana Assistant runs in Grafana Cloud to support enterprise needs and manage infrastructure at scale. We’re committed to OSS and continue to invest heavily in it — including open sourcing tools like the LLM plugin and MCP server, so the community can build their own AI-powered experiences into Grafana OSS.


