
Plugins 〉Peak Report


The Peak Report plugin has been deprecated and is no longer maintained.
Peak Report


Grafana Peak Report
A peak report panel for Grafana.
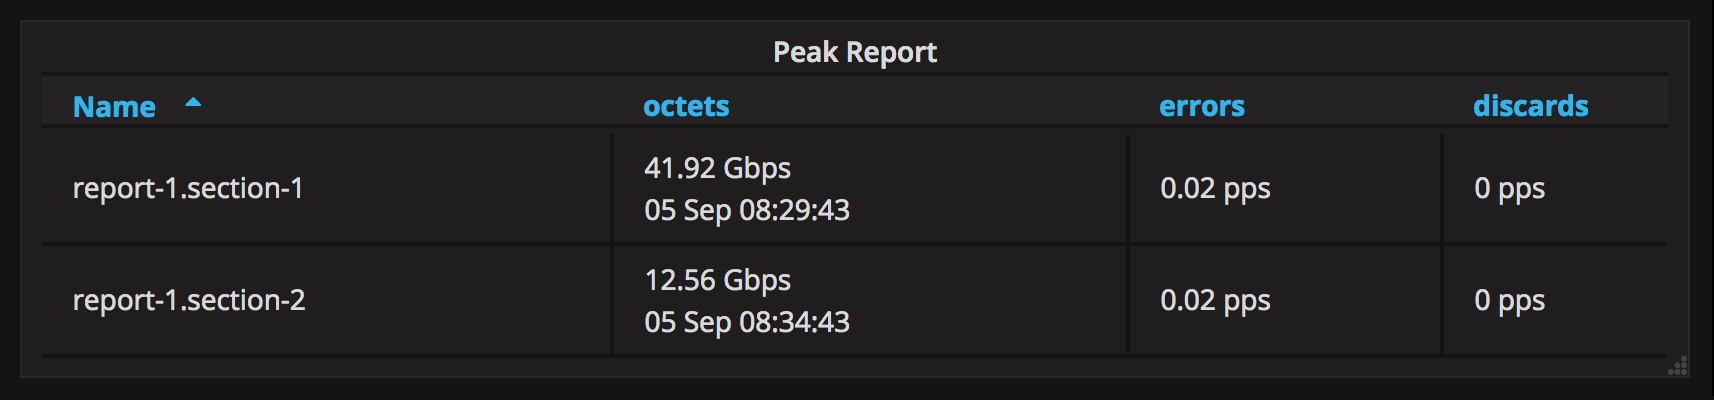
This panel shows a table that summarises multiple series into a report of peak values. Each row is formed by grouping series together using the first few components of the metric name. The cells for a row are calculated using some or all of its series, filtered by regex. The value for a cell is the maximum across all the series matching the column regex.
Compatibility
This panel should work with the following data sources: Graphite
Development
Docker is an easy way to spin-up an instance of Grafana. With docker installed, run the following command in the directory containing the plugin; this will expose the local plugin on your machine to the Grafana container so you can test it out.
docker run -it -v $PWD:/var/lib/grafana/plugins/peak_report -p 3000:3000 --name grafana.docker grafana/grafana
Now do this...
# Install development packages
npm install
Install the grunt-cli
sudo npm install -g grunt-cli
Compile into dist/
grunt
Restart Grafana to see it
docker restart grafana.docker
Watch for changes (requires refresh)
grunt watch
Use grunt test to run the Jasmine tests for the plugin; and grunt eslint to check for style issues. Note that the plugin controller isn't tested because it depends on Grafana native libraries, which aren't available outside of Grafana.
Contributing
For bugs and new features, open an issue and we'll take a look. If you want to contribute to the plugin, you're welcome to submit a pull request - just make sure grunt runs without errors first.
Grafana Cloud Free
- Free tier: Limited to 3 users
- Paid plans: $55 / user / month above included usage
- Access to all Enterprise Plugins
- Fully managed service (not available to self-manage)
Self-hosted Grafana Enterprise
- Access to all Enterprise plugins
- All Grafana Enterprise features
- Self-manage on your own infrastructure
Installing Peak Report on Grafana Cloud:
Installing plugins on a Grafana Cloud instance is a one-click install; same with updates. Cool, right?
Note that it could take up to 1 minute to see the plugin show up in your Grafana.
Warning
Plugin installation from this page will be removed in February 2026. Use the Plugin Catalog in your Grafana instance instead. Refer to Install a plugin in the Grafana documentation for more information.
Installing plugins on a Grafana Cloud instance is a one-click install; same with updates. Cool, right?
Note that it could take up to 1 minute to see the plugin show up in your Grafana.
Installing plugins on a Grafana Cloud instance is a one-click install; same with updates. Cool, right?
Note that it could take up to 1 minute to see the plugin show up in your Grafana.
Warning
Plugin installation from this page will be removed in February 2026. Use the Plugin Catalog in your Grafana instance instead. Refer to Install a plugin in the Grafana documentation for more information.
Installing plugins on a Grafana Cloud instance is a one-click install; same with updates. Cool, right?
Note that it could take up to 1 minute to see the plugin show up in your Grafana.
For more information, visit the docs on plugin installation.
Installing on a local Grafana:
For local instances, plugins are installed and updated via a simple CLI command. Plugins are not updated automatically, however you will be notified when updates are available right within your Grafana.
1. Install the Panel
Use the grafana-cli tool to install Peak Report from the commandline:
grafana-cli plugins install The plugin will be installed into your grafana plugins directory; the default is /var/lib/grafana/plugins. More information on the cli tool.
Alternatively, you can manually download the .zip file for your architecture below and unpack it into your grafana plugins directory.
Alternatively, you can manually download the .zip file and unpack it into your grafana plugins directory.
2. Add the Panel to a Dashboard
Installed panels are available immediately in the Dashboards section in your Grafana main menu, and can be added like any other core panel in Grafana.
To see a list of installed panels, click the Plugins item in the main menu. Both core panels and installed panels will appear.