Redis Exporter
On this page:
Introduction
The following quickstart provides setup instructions and preconfigured dashboards, alerting rules, and recording rules for Redis Exporter. After running through the steps in this quickstart, you will have:
Set up and configured Redis Exporter to collect Redis metrics like Redis uptime, commands executed per second, memory utilization, and more. Most items from the
redis infocommand are exported. Redis Exporter will expose these as Prometheus-style metrics.Configured Prometheus to scrape Redis Exporter metrics and optionally ship them to Grafana Cloud.
Set up a preconfigured and curated set of recording rules to cache frequent Prometheus queries.
Imported Grafana dashboards to visualize your metrics data.
Set up Prometheus alerting rules to alert on your metrics data.
Metrics usage
This exporter publishes roughly 190 Prometheus time series by default. To see a list of metrics shipped by default with this exporter, please download a sample metrics scrape here.
Note that depending on its configuration, Redis Exporter may collect and publish far more metrics than this default set. To learn more about configuring Redis Exporter and toggling its collectors, please see the Redis Exporter GitHub repository.
Beyond toggling Redis Exporter’s settings, you can reduce metrics usage by dropping time series you don’t need to store in Prometheus or Grafana Cloud. To learn how to do this, please see Reducing Prometheus metrics usage with relabeling from the Grafana Cloud docs.
Grafana Cloud’s Redis Exporter Integration
If you’re using Grafana Cloud, you can skip all of the steps in this guide by installing the Redis Exporter Integration, which is designed to help you get up and running in a few commands and clicks. Sign up for free.
To learn how to set up Redis Exporter using the Redis Exporter Integration, please see Redis Exporter Integration from the Grafana Cloud docs.
On this page:
Redis Exporter Quickstart
In this guide you’ll learn how to set up and configure the Redis Exporter to collect Redis metrics like Redis uptime, commands executed per second and memory utilization, and expose them as Prometheus-style metrics. You’ll then configure Prometheus to scrape Redis metrics and optionally ship them to Grafana Cloud. Finally, you’ll set up a preconfigured and curated set of recording rules, Grafana dashboards, and alerting rules. At the end of this guide you’ll have dashboards that you can use to visualize your Redis metrics, and set of preconfigured alerts.
If you’re using Grafana Cloud, the Redis Integration can help you get up and running quickly. The Redis Integration embeds the Redis Exporter into the Grafana Cloud Agent and automatically provisions alerting rules and dashboards, so you don’t have to run through the steps in this guide. To learn how to set up Redis Exporter using the Redis Integration, please see Redis Integration from the Grafana Cloud docs.
Prerequisites
Before you get started, you should have the following available to you:
- A Redis Server and port 6379 reachable for Redis Exporter to connect to, see their downloads page if you don’t have Redis installed.
- A Linux machine compatible with a Redis Exporter release. To see a list of available releases, please see Releases.
- Prometheus running in your environment or directly on the machine. To learn how to install Prometheus, please see Installation from the Prometheus docs.
- Grafana running in your environment or directly on the machine. To learn how to install Grafana, please see Install Grafana from the Grafana docs.
- (Optional) A Grafana Cloud account. Grafana Cloud hosts Grafana and a Mimir-based Prometheus metrics endpoint. You will still need to scrape metrics, using either Prometheus installed in your environment, or the Grafana Cloud Agent. To learn more about Grafana Cloud, please see Grafana Cloud.
Step 1: Setting up Redis Exporter
In this step you’ll set up the Redis exporter on your machine to collect and expose Redis metrics in Prometheus format. This guide uses an Ubuntu 20.04 system with Redis Server v6.2.1. Steps may vary slightly depending on your operating system and Redis version.
To begin, log in to your machine and download the relevant Redis Exporter binary. This guide uses the linux-amd64 binary but you should choose the one corresponding to your system’s OS and architecture:
wget https://github.com/oliver006/redis_exporter/releases/download/v1.18.0/redis_exporter-v1.18.0.linux-amd64.tar.gzReplace v1.18.0 with the version you’d like to install. This guide may become stale so it’s best to check the Redis Exporter Releases page for the latest stable version.
Unzip the tarball and cd into the directory:
tar xvfz redis_exporter-v1.18.0.linux-amd64.tar.gz
cd redis_exporter-v1.18.0.linux-amd64When running the Redis Exporter, you need to specify the address of where your Redis Server is running. This may be different from your setup, by default the Redis Exporter will connect to localhost, but the address can be set by using the -redis.addr flag.
Finally, run the exporter:
./redis_exporter -redis.addr redis://localhost:6379INFO[0000] Redis Metrics Exporter v1.18.0 build date: 2021-03-11-03:26:58 sha1: d0597c841d2c9fa30ce8b6ded6251d1994822e27 Go: go1.16.1 GOOS: linux GOARCH: amd64
INFO[0000] Providing metrics at :9121/metricsIf you see the above output, you successfully ran Redis Exporter.
Redis Exporter publishes Redis metrics in Prometheus format on port 9121. You can test this using curl. You will need to open a new SSH session or background the Redis Exporter process to use curl.
curl http://localhost:9121/metrics. . .
redis_cluster_connections 0
# HELP redis_cluster_enabled cluster_enabled metric
# TYPE redis_cluster_enabled gauge
redis_cluster_enabled 0
# HELP redis_commands_duration_seconds_total Total amount of time in seconds spent per command
# TYPE redis_commands_duration_seconds_total counter
redis_commands_duration_seconds_total{cmd="client"} 1.7e-05
redis_commands_duration_seconds_total{cmd="command"} 0.000443
redis_commands_duration_seconds_total{cmd="config"} 0.000178
redis_commands_duration_seconds_total{cmd="info"} 8.1e-05
redis_commands_duration_seconds_total{cmd="latency"} 8e-06
redis_commands_duration_seconds_total{cmd="set"} 1.7e-05
redis_commands_duration_seconds_total{cmd="slowlog"} 1.4e-05
# HELP redis_commands_processed_total commands_processed_total metric
# TYPE redis_commands_processed_total counter
redis_commands_processed_total 10If you see the above output, you’re ready to begin scraping Redis metrics using Prometheus.
To avoid running and managing Redis Exporter from the command line, you can create a systemd service. To learn how to do this, please see Creating a systemd service to manage the agent. Replace the path to the agent binary with the path to Redis Exporter.
Redis Exporter provides features such as:
- Authenticating against Redis
- TLS configuration
- Redis-only metrics
And much more. To learn more about these features, please see the Redis Exporter GitHub repository.
Step 2: Scraping Redis Exporter using Prometheus
Now that the Redis Exporter is up and running on your machine, you can configure a Prometheus scrape job to collect and store Redis Exporter metrics.
Add the following scrape job config to the scrape_configs section of your prometheus.yml configuration file:
- job_name: redis
  static_configs:
- targets: ['redis_exporter_machine_IP_address:9121']Replace redis_exporter_machine_IP_address with the IP address of the machine running Redis Exporter. If you’re running Prometheus on the same machine, this will be localhost. To learn more about configuring Prometheus, please see Configuration from the Prometheus docs.
If you don’t have a prometheus.yml configuration file, create a simple one using your favorite text editor. Open your preferred text editor and paste in the following Prometheus configuration:
global:
  scrape_interval: 15s

scrape_configs:
- job_name: redis
  static_configs:
- targets: ['redis_exporter_machine_IP_address:9121']This configuration tells Prometheus to scrape all jobs every 15 seconds. The only configured scrape job is called redis-exporter and defines a redis_exporter_machine_IP_address:9121 target. By default, Prometheus will scrape the /metrics endpoint using HTTP.
Save and close the file. You can then run Prometheus with the file using the following command:
./prometheus --config.file=./prometheus.ymlShipping metrics to Grafana Cloud
To ship Redis Exporter metrics to Grafana Cloud from Prometheus, configure the remote_write parameter in your prometheus.yml configuration file. To learn more, please see Metrics — Prometheus from the Grafana Cloud docs. To learn more about the remote_write parameter, please see remote_write from the Prometheus docs.
Step 3: Configure recording rules
Using recording rules, you can precompute and cache frequently queried metrics. For example, if a dashboard panel uses a computationally intensive query like a rate(), you can create a recording rule that runs at a regular reduced interval and saves the result of the intensive query in a new time series. This avoids fetching and computing data every time the dashboard gets refreshed. To learn more about Prometheus recording rules, please see Recording Rules from the Prometheus docs.
Note: You should load the following recording rules before loading the dashboards in this guide.
The dashboard queries and alerting rules use recording rules to reduce load on the Prometheus or Grafana Cloud Metrics servers, depending on where you’re evaluating the rules.
You can fetch the recording rule YAML file here.
This recording rule YAML file was generated using the Redis Exporter mixin.
Load recording rules into Prometheus
To load recording rules into Prometheus, add the following to your prometheus.yml configuration file:
rule_files:
- "redis_exporter_recording_rules.yml"Be sure to replace redis_exporter_recording_rules.yml with the path to your Redis Exporter recording rules YAML file.
Load recording rules into Grafana Cloud
To learn how to load recording rules into Grafana Cloud, please see Prometheus and Loki rules with cortextool.
Step 4: Configuring dashboards
This quickstart includes the following dashboard:
- Redis Dashboard for Prometheus Redis Exporter
To learn how to import these dashboards into Grafana, please see Importing a dashboard from the Grafana docs.
Note: These dashboard queries may depend on the recording rules defined in the previous step. Be sure to import these before importing the dashboards.
You can fetch the dashboards here.
Step 5: Configuring alerts
With Prometheus alerting rules, you can define alerts that fire when PromQL expressions breach some threshold or satisfy specified conditions over a period of time. For example, you can define a HighRequestLatency alert that fires when a request latency metric is greater than some threshold over a period of time. As soon as the alerting condition is triggered, the alert moves into Pending state. After satisfying the condition for the period of time defined by the for parameter, the alert moves into Firing state. You can configure routing and notifications for firing alerts using a tool like Alertmanager. Alertmanager is also built-in to Grafana Cloud.
You can fetch the alerting rule YAML file here.
Load alerting rules into Prometheus
To load alerting rules into Prometheus, add the following to your prometheus.yml configuration file:
rule_files:
- "redis_exporter_alerting_rules.yml"Be sure to replace redis_exporter_alerting_rules.yml with the path to your Redis alerting rules YAML file.
Load alerting rules into Grafana Cloud
To learn how to load alerting rules into Grafana Cloud, please see Prometheus and Loki rules with cortextool.
Conclusion
In this quickstart you installed and ran Redis Exporter on your Linux machine. You then configured Prometheus to scrape the Redis metrics exposed by Redis Exporter. You loaded recording rules and alerting rules into Prometheus, and finally imported Grafana dashboards to visualize your Redis metrics.
If you’re using Grafana Cloud, you can skip all of the steps in this guide by installing the Redis integration with the Grafana Cloud Agent. This integration embeds a preconfigured Redis Exporter into the agent and automatically provisions Grafana dashboards and Prometheus alerting and recording rules, so you don’t have to import them manually. To learn how to set up the Redis integration, please see Grafana Cloud Integrations.
The dashboards, recording rules, and alerting rules were generated using the Redis Exporter Mixin. Mixins are reusable templates for dasboards, recording rules, and alerts curated and designed by subject matter experts. To learn more, please see the Redis Mixin repository.
On this page:
Note: You should load the following recording rules before loading the dashboards in this guide. The dashboard queries use recording rules to reduce load on the Prometheus or Grafana Cloud Metrics servers, depending on where you’re evaluating the rules.
This quickstart includes the following recording rules:
redis_memory_fragmentation_ratio
groups:
- name: redis_rules
  rules:
  - expr: redis_memory_used_rss_bytes / redis_memory_used_bytes
record: redis_memory_fragmentation_ratioThis recording rule YAML file was generated using the Redis Exporter mixin.
On this page:
Note: These dashboards may depend on the recording rules in the previous tab. Be sure to import these before importing the dashboards.
Redis Dashboard
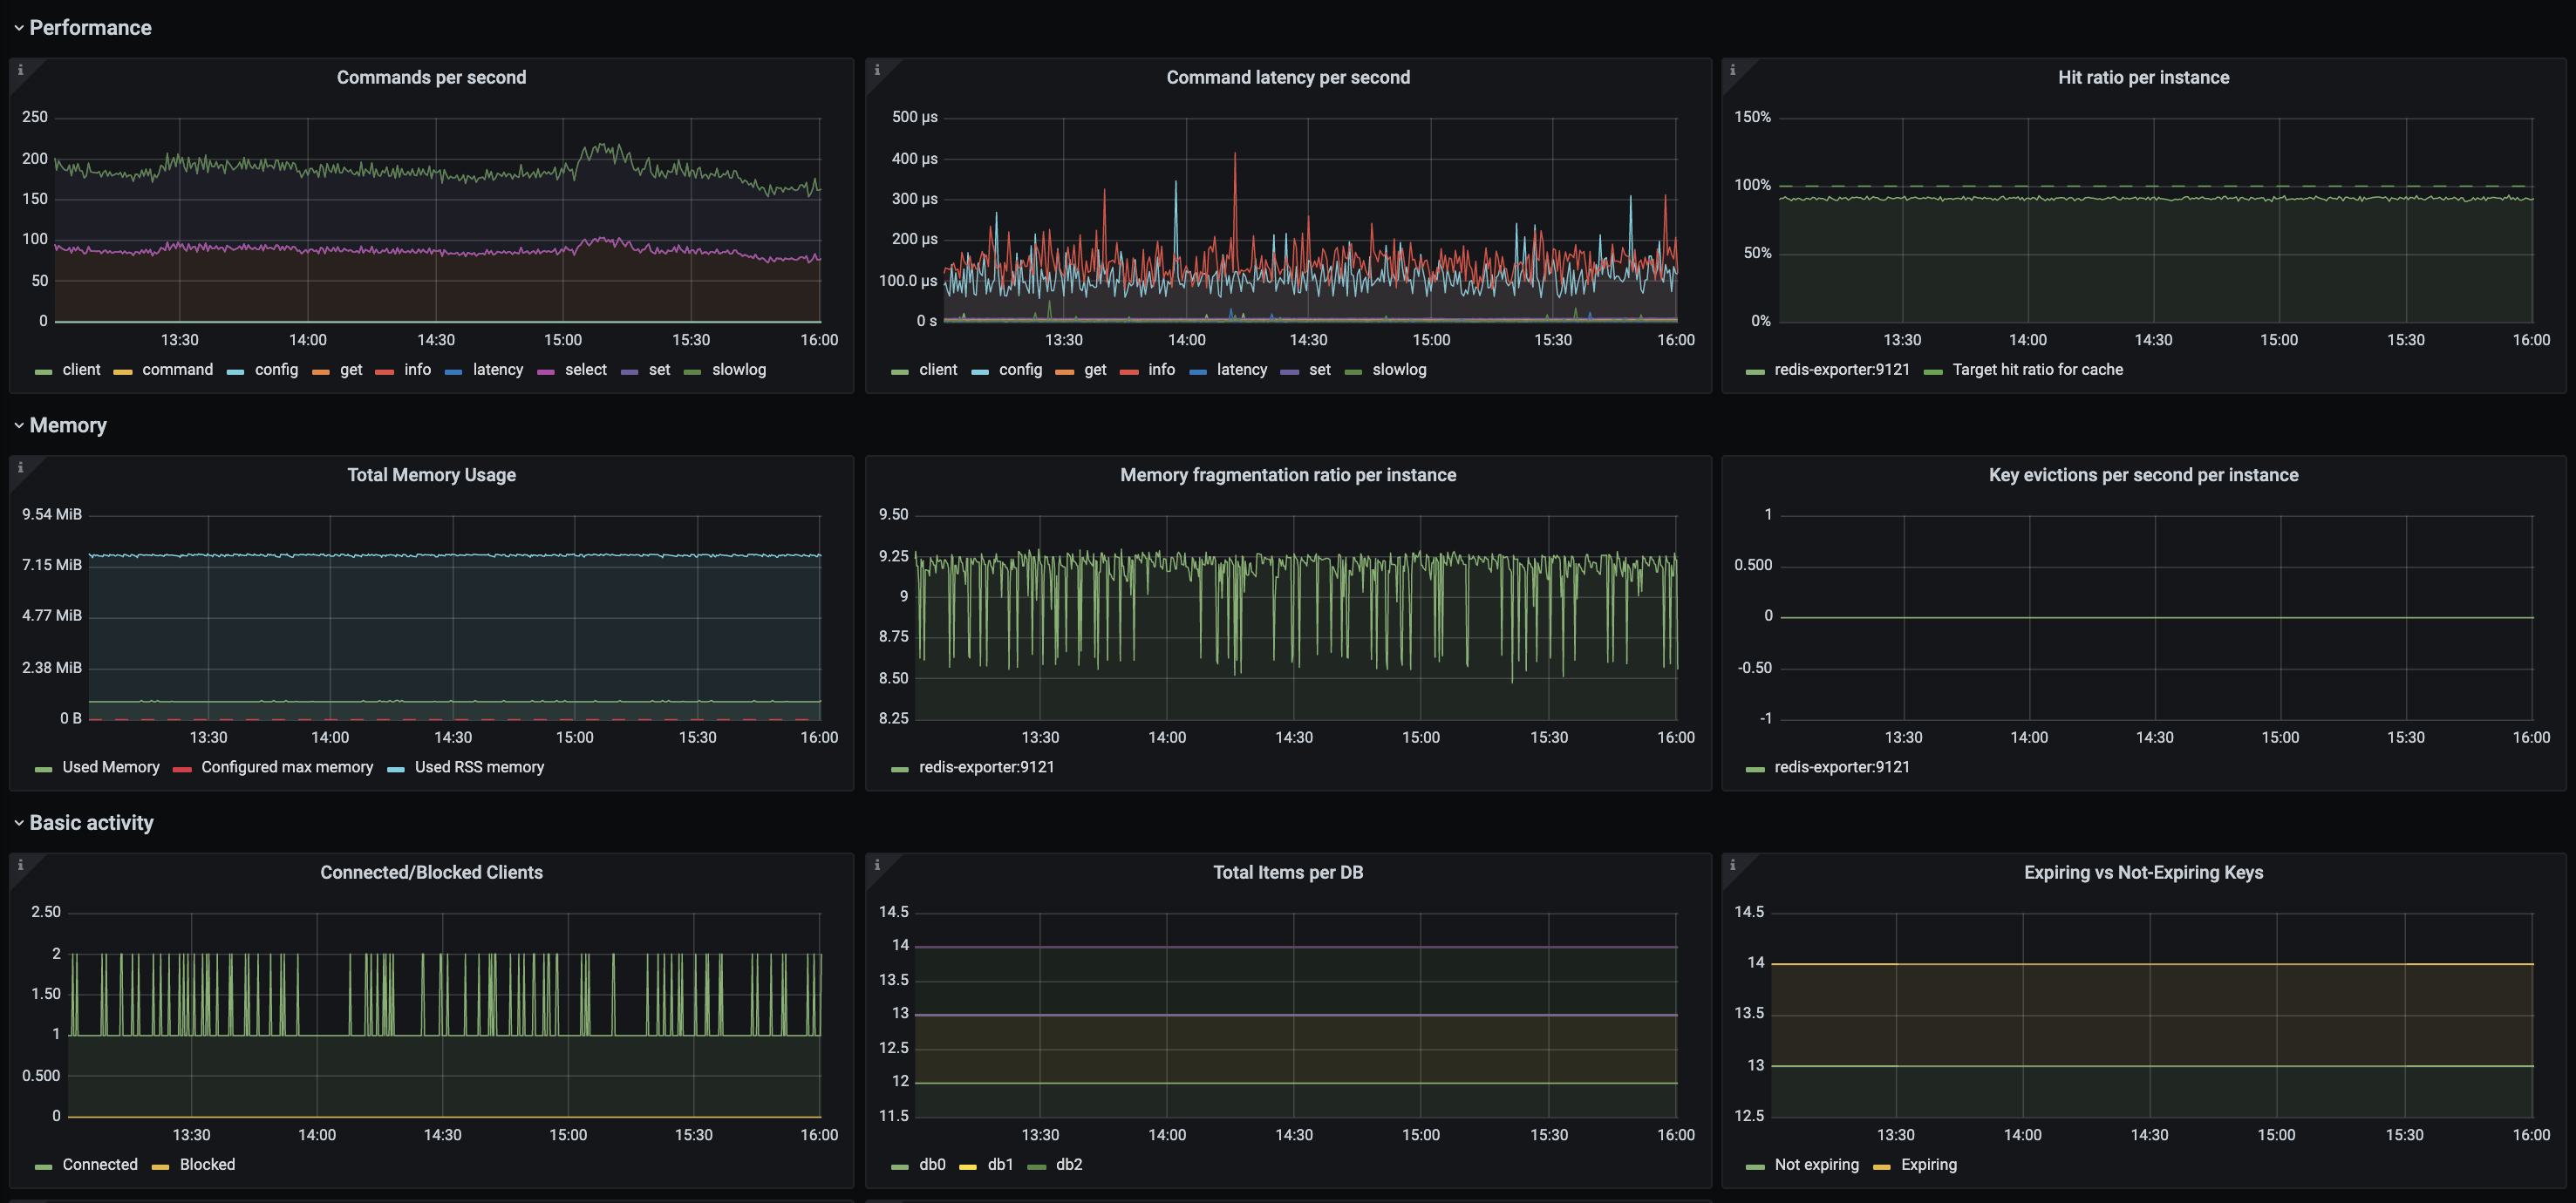
This dashboard includes panels for the following metrics:
- Commands Per Second
- Commands Latency Per Second
- Hit Ratio Per Instance
- Total Memory Usage
- Memory Fragmantation Ratio Per Instance
- Key Evictions Per Second Per Instance
- Connected/Blocked Clients
- Total Items Per DB
- Expiring vs Non-Expiring Keys
- Connected Slaves Per Instance
- Time Since Last Master Connection
You can import the dashboard directly using the following dashboard ID: 763
You can fetch the dashboard JSON here.
This dashboard was generated using the Redis Exporter mixin.
On this page:
This quickstart includes the following alerting rules:
RedisDown
Redis instance is down
RedisOutOfMemory
Redis is running out of memory
RedisTooManyConnections
Redis has more than X connected clients
Download the following alerting rules YAML filegroups:
- name: redis
rules:
- alert: RedisDown
annotations:
description: |-
Redis instance is down
VALUE = {{ $value }}
LABELS: {{ $labels }}
summary: Redis down (instance {{ $labels.instance }})
expr: redis_up == 0
for: 5m
labels:
severity: critical
- alert: RedisOutOfMemory
annotations:
description: |-
Redis is running out of memory (> 90%)
VALUE = {{ $value }}
LABELS: {{ $labels }}
summary: Redis out of memory (instance {{ $labels.instance }})
expr: redis_memory_used_bytes / redis_total_system_memory_bytes * 100 > 90
for: 5m
labels:
severity: warning
- alert: RedisTooManyConnections
annotations:
description: |-
Redis instance has too many connections
VALUE = {{ $value }}
LABELS: {{ $labels }}
summary: Redis too many connections (instance {{ $labels.instance }})
expr: redis_connected_clients > 100
for: 5m
labels:
severity: warningThis alerting rule YAML file was generated using the Redis Exporter mixin.
On this page:
Grafana Cloud comes with an ever-expanding set of integrations to quickly get an observability stack up and running in minutes. The Redis Integration, built-in to the Grafana Cloud Agent, exposes and scrapes essential Redis metrics and pushes them to Grafana Cloud. The agent will scrape metrics using an embedded Redis Exporter, and Grafana Cloud will automatically provision tailored Grafana dashboards and alerts for visualizing and acting on this data.
To learn more, check out the Grafana Cloud docs.
How it works
Configuring, installing, connecting, and maintaining Prometheus monitoring components typically involves significant domain knowledge. It can take quite a while to go from setup to dashboard and alerts. As the creators of Grafana - and core contributors to Prometheus and Cortex - we build simple integrations to abstract some of this work away in order to quickly get started. How it works:
- Sign up (or log in) for a free Grafana Cloud account.
- Select the target you’d like to observe (an ever-expanding catalogue).
- Run a one-line command to install the Grafana Agent. The agent embeds and preconfigures Exporters to expose default metrics, and pushes them to the Grafana Cloud metrics backend.
- Voila! You’ll see tailored Grafana dashboards and will benefit from sane alerting defaults.
Looking for a different Exporter or integration? Check out our growing library of integrations for popular components like MySQL, Postgres, Redis, Memcached and more.