Node.js Exporter
On this page:
Introduction
The following quickstart provides setup instructions and preconfigured dashboards, alerting rules, and recording rules for the prom-client for Node.js Prometheus metrics exporter. After running through the steps in this quickstart, you will have:
Set up and configured prom-client for Node.js to collect Node.js app metrics like event loop lag, active handles, and GC metrics. prom-client for Node.js will expose these as Prometheus-style metrics.
Configured Prometheus to scrape prom-client for Node.js metrics and optionally ship them to Grafana Cloud.
Set up a preconfigured and curated set of recording rules to cache frequent Prometheus queries.
Imported Grafana dashboards to visualize your metrics data.
Set up Prometheus alerting rules to alert on your metrics data.
Metrics usage
This exporter publishes roughly 78 Prometheus time series by default. To see a list of metrics shipped by default with this exporter, please download a sample metrics scrape here.
Note that depending on its configuration, prom-client for Node.js may collect and publish far more metrics than this default set. To learn more about configuring prom-client for Node.js and toggling its collectors, please see the prom-client for Node.js GitHub repository.
Beyond toggling prom-client for Node.js’s settings, you can reduce metrics usage by dropping time series you don’t need to store in Prometheus or Grafana Cloud. To learn how to do this, please see Reducing Prometheus metrics usage with relabeling from the Grafana Cloud docs.
Grafana Cloud’s Node.js Integration
If you’re using Grafana Cloud, you can skip all of the steps in this guide by installing the Node.js Integration, which is designed to help you get up and running in a few commands and clicks. Sign up for free.
To learn how to collect Node.js metrics using the Node.js Integration, please see Node.js Integration from the Grafana Cloud docs.
On this page:
prom-client for Node.js Quickstart
In this guide you’ll learn how to set up and configure prom-client for Node.js to collect Node.js metrics like event loop lag and active handles and expose them as Prometheus-style metrics. You’ll then configure Prometheus to scrape Node.js metrics and optionally ship them to Grafana Cloud. Finally, you’ll set up a preconfigured and curated set of Grafana dashboards, and alerting rules. At the end of this guide you’ll have dashboards that you can use to visualize your Node.js metrics, and a set of preconfigured alerts.
If you’re using Grafana Cloud, the Node.js Integration can help you get up and running quickly. The Node.js Integration embeds prom-client for Node.js into the Grafana Cloud Agent and automatically provisions alerting rules and dashboards, so you don’t have to run through the steps in this guide. To learn how to set up prom-client for Node.js using the Node.js Integration, please see Node.js Integration from the Grafana Cloud docs.
Prerequisites
Before you get started, you should have the following available to you:
- Node.js installed on your machine. To learn more, please see Downloads from the Node.js site.
- Prometheus running in your environment or directly on the machine. To learn how to install Prometheus, please see Installation from the Prometheus docs.
- Grafana running in your environment or directly on the machine. To learn how to install Grafana, please see Install Grafana from the Grafana docs.
- (Optional) A Grafana Cloud account. Grafana Cloud hosts Grafana and a Mimir-based Prometheus metrics endpoint. You will still need to scrape metrics, using either Prometheus installed in your environment, or the Grafana Cloud Agent. To learn more about Grafana Cloud, please see Grafana Cloud.
Step 1: Setting up prom-client for Node.js
In this step you’ll set up prom-client for Node.js to collect and expose Node.js metrics in Prometheus format. This guide uses an Ubuntu 20.04 system with Node.js version 15.11.0. Steps may vary slightly depending on your operating system and Node.js version.
This guide will demonstrate setup steps for a new Node.js app. To instrument an existing Node.js app, please see the prom-client GitHub repository.
To begin, log in to your machine and create a new app directory called app. Navigate into this directory:
mkdir app
cdInitialize the Node project using npm init:
npm initUse the defaults for everything, except for the following prompt:
entry point: (index.js)For this prompt, enter app.js then hit ENTER.
Next, install express and prom-client using npm:
npm install express prom-client --saveFinally, create the minimal app using your favorite text editor. Open a file called app.js and paste in the following:
import express from 'express';
import { collectDefaultMetrics, register } from 'prom-client';

collectDefaultMetrics();

const app = express();

app.get('/metrics', async (_req, res) => {
  try {
    res.set('Content-Type', register.contentType);
    res.end(await register.metrics());
  } catch (err) {
    res.status(500).end(err);
  }
});

app.listen(4001, '0.0.0.0');This barebones app collects a standard set of Node.js metrics and exposes them in Prometheus format at the /metrics endpoint. It listens for requests on port 4001 at localhost.
When you’re done, save and close the file.
Finally, run the app using Node:
node app.jsYou won’t see any output, but your shell should hang. In another session, simulate a Prometheus scrape using curl:
curl localhost:4001/metrics. . .
# HELP nodejs_gc_duration_seconds Garbage collection duration by kind, one of major, minor, incremental or weakcb.
# TYPE nodejs_gc_duration_seconds histogram
nodejs_gc_duration_seconds_bucket{le="0.001",kind="incremental"} 2
nodejs_gc_duration_seconds_bucket{le="0.01",kind="incremental"} 4
nodejs_gc_duration_seconds_bucket{le="0.1",kind="incremental"} 4
nodejs_gc_duration_seconds_bucket{le="1",kind="incremental"} 4
nodejs_gc_duration_seconds_bucket{le="2",kind="incremental"} 4
nodejs_gc_duration_seconds_bucket{le="5",kind="incremental"} 4
nodejs_gc_duration_seconds_bucket{le="+Inf",kind="incremental"} 4
nodejs_gc_duration_seconds_sum{kind="incremental"} 0.007554849
nodejs_gc_duration_seconds_count{kind="incremental"} 4
nodejs_gc_duration_seconds_bucket{le="0.001",kind="major"} 0
nodejs_gc_duration_seconds_bucket{le="0.01",kind="major"} 2
nodejs_gc_duration_seconds_bucket{le="0.1",kind="major"} 2
nodejs_gc_duration_seconds_bucket{le="1",kind="major"} 2
nodejs_gc_duration_seconds_bucket{le="2",kind="major"} 2
nodejs_gc_duration_seconds_bucket{le="5",kind="major"} 2
nodejs_gc_duration_seconds_bucket{le="+Inf",kind="major"} 2
nodejs_gc_duration_seconds_sum{kind="major"} 0.007220236999999999
nodejs_gc_duration_seconds_count{kind="major"} 2If you see the above output, you successfully installed prom-client into your Node.js app. You’re ready to begin scraping Node.js metrics using Prometheus.
Beyond collectDefaultMetrics, prom-client can collect custom Node.js metrics and allows you to configure metric labels. To learn more about these features, please see the prom-client for Node.js GitHub repository.
Step 2: Scraping prom-client metrics using Prometheus
Now that prom-client is up and running on your machine, you can configure a Prometheus scrape job to collect and store Node.js metrics.
Add the following scrape job config to the scrape_configs section of your prometheus.yml configuration file:
- job_name: nodejs
  static_configs:
- targets: ['localhost:4001']Replace localhost with the IP address of the machine running Node.js. If you’re running Prometheus on the same machine, this will be localhost. To learn more about configuring Prometheus, please see Configuration from the Prometheus docs.
If you don’t have a prometheus.yml configuration file, create a simple one using your favorite text editor. Open your preferred text editor and paste in the following Prometheus configuration:
global:
  scrape_interval: 15s

scrape_configs:
- job_name: nodejs
  static_configs:
- targets: ['localhost:4001']This configuration tells Prometheus to scrape all jobs every 15 seconds. The only configured scrape job is called nodejs and defines a localhost:4001 target. By default, Prometheus will scrape the /metrics endpoint using HTTP.
Save and close the file. You can then run Prometheus with the file using the following command:
./prometheus --config.file=./prometheus.ymlShipping metrics to Grafana Cloud
To ship Node.js metrics to Grafana Cloud from Prometheus, configure the remote_write parameter in your prometheus.yml configuration file. To learn more, please see Metrics — Prometheus from the Grafana Cloud docs. To learn more about the remote_write parameter, please see remote_write from the Prometheus docs.
Step 3: Configuring dashboards
This quickstart includes one dashboard:
- Node.js Overview
To learn how to import this dashboards into Grafana, please see Importing a dashboard from the Grafana docs.
You can fetch the dashboards here.
Step 4: Configuring alerts
With Prometheus alerting rules, you can define alerts that fire when PromQL expressions breach some threshold or satisfy specified conditions over a period of time. For example, you can define a HighRequestLatency alert that fires when a request latency metric is greater than some threshold over a period of time. As soon as the alerting condition is triggered, the alert moves into Pending state. After satisfying the condition for the period of time defined by the for parameter, the alert moves into Firing state. You can configure routing and notifications for firing alerts using a tool like Alertmanager. Alertmanager is also built-in to Grafana Cloud.
You can fetch the alerting rule YAML file here.
Load alerting rules into Prometheus
To load alerting rules into Prometheus, add the following to your prometheus.yml configuration file:
rule_files:
- "nodejs-rules.yml"Be sure to replace nodejs-rules.yml with the path to your Node.js app alerting rules YAML file.
Load alerting rules into Grafana Cloud
To learn how to load alerting rules into Grafana Cloud, please see Prometheus and Loki rules with cortextool.
Conclusion
In this quickstart you installed and ran prom-client for Node.js on your Linux machine. You then configured Prometheus to scrape the database and Node.js app metrics exposed by prom-client for Node.js. You loaded recording rules and alerting rules into Prometheus, and finally imported Grafana dashboards to visualize your Node.js app metrics.
If you’re using Grafana Cloud, you can skip all of the steps in this guide by installing the Node.js app integration with the Grafana Cloud Agent. This integration embeds a preconfigured prom-client for Node.js into the agent and automatically provisions Grafana dashboards and Prometheus alerting and recording rules, so you don’t have to import them manually. To learn how to set up the Node.js app integration, please see Grafana Cloud Integrations.
The dashboards, recording rules, and alerting rules were generated using the prom-client for Node.js Mixin. Mixins are reusable templates for dasboards, recording rules, and alerts curated and designed by subject matter experts. To learn more, please see the Node.js app Mixin repository.
On this page:
Node.js Overview Dashboard
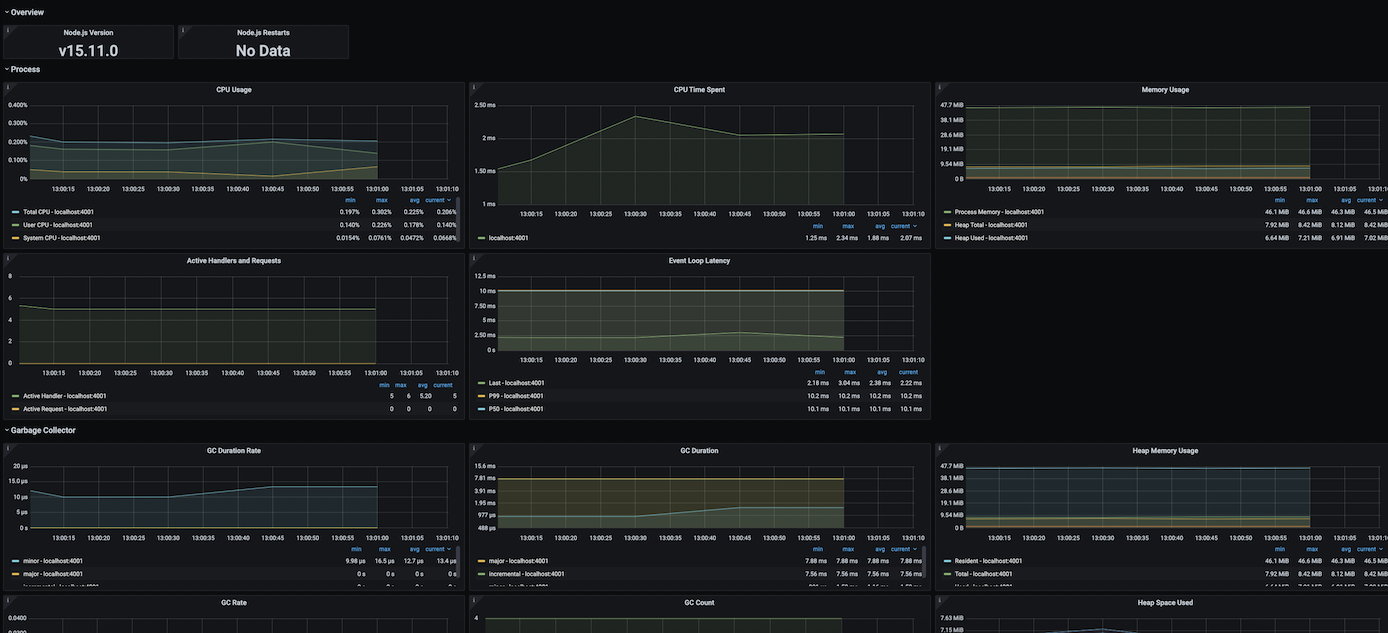
This dashboard includes panels for the following metrics:
- Node.js Version
- Node.js Restarts
- CPU Usage
- CPU Time Spent
- Memory Usage
- Active Handlers and Requests
- Event Loop Latency
- GC Duration Rate
- GC Duration
- Heap Memory Usage
- GC Rate
- GC Count
- Heap Space Used
You can import the dashboard directly using the following dashboard ID: 14058.
You can fetch the dashboard JSON here.
This dashboard was generated using the prom-client for Node.js mixin.
On this page:
This quickstart includes the following alerting rules:
NodejsDown
Node.js job on instance is not up.
groups:
  - name: NodejsAlerts
    rules:
      - alert: NodejsDown
        expr: process_start_time_seconds != 1
        for: 5m
        labels:
          severity: critical
        annotations:
          description: 'Node.js {{$labels.job}} on {{$labels.instance}} is not up.'
summary: Node.js not upThis alerting rule YAML file was generated using the prom-client for Node.js mixin.
On this page:
Grafana Cloud comes with an ever-expanding set of integrations to quickly get an observability stack up and running in minutes. The Node.js app Integration, built-in to the Grafana Cloud Agent, exposes and scrapes essential Node.js app metrics and pushes them to Grafana Cloud. The agent will scrape metrics using an embedded prom-client for Node.js, and Grafana Cloud will automatically provision tailored Grafana dashboards and alerts for visualizing and acting on this data.
To learn more, check out the Grafana Cloud docs.
How it works
Configuring, installing, connecting, and maintaining Prometheus monitoring components typically involves significant domain knowledge. It can take quite a while to go from setup to dashboard and alerts. As the creators of Grafana - and core contributors to Prometheus and Cortex - we build simple integrations to abstract some of this work away in order to quickly get started. How it works:
- Sign up (or log in) for a free Grafana Cloud account.
- Select the target you’d like to observe (an ever-expanding catalogue).
- Run a one-line command to install the Grafana Agent. The agent embeds and preconfigures Exporters to expose default metrics, and pushes them to the Grafana Cloud metrics backend.
- Voila! You’ll see tailored Grafana dashboards and will benefit from sane alerting defaults.
Looking for a different Exporter or integration? Check out our growing library of integrations for popular components like MySQL, Postgres, Redis, Memcached and more.