Get the latest research on the benefits and impact of observability *
*No email required
We’ve licensed, developed, and curated these resources to help you discover the role of observability in enhancing visibility, driving growth, and future-proofing your business.
2025 Gartner® Magic Quadrant™ for Observability Platforms
Top 4 observability impacts
Improve customer retention
With a systematic approach to observability, teams know about issues before they affect users.
Accelerate time to market
Centralized observability allows developers to focus on their core tasks, improving productivity and driving innovation.
Lower the total cost of ownership
With visibility across the business, companies can get more value from their investments.
De-risk business operations
Open standards like OpenTelemetry help orgs avoid vendor lock-in.
79%
of Observability Survey respondents with centralized observability have saved time or money
“
We reduced downtime by 30% and accelerated feature delivery by 15%. Centralized observability didn’t just save time and money — it became a strategic enabler for growth.”
– VP at a software and technology company with 5,000+ employees
Gartner analyst reports on observability
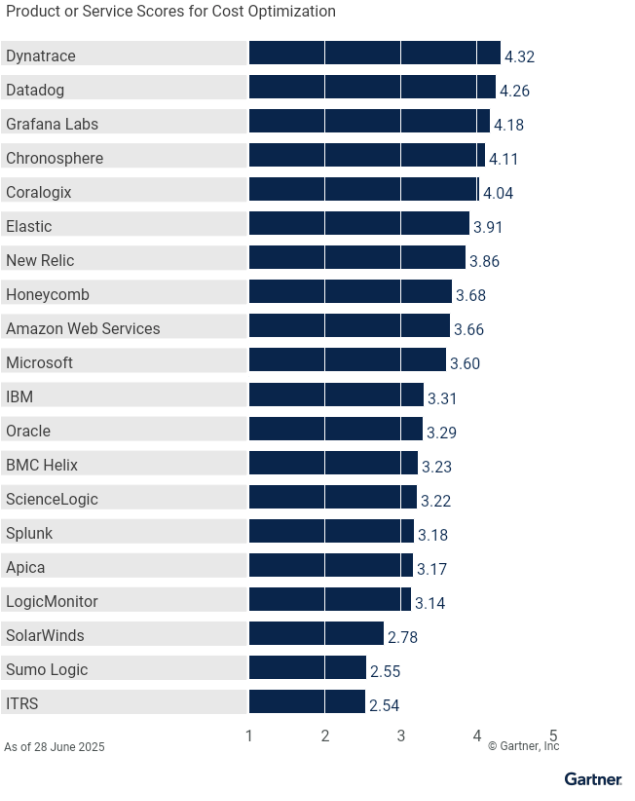
2025 Gartner® Critical Capabilities for Observability Platforms
Grafana Labs ranks among the 4 highest scoring vendors across all use cases, including AI engineering, cost optimization, and platform operations.
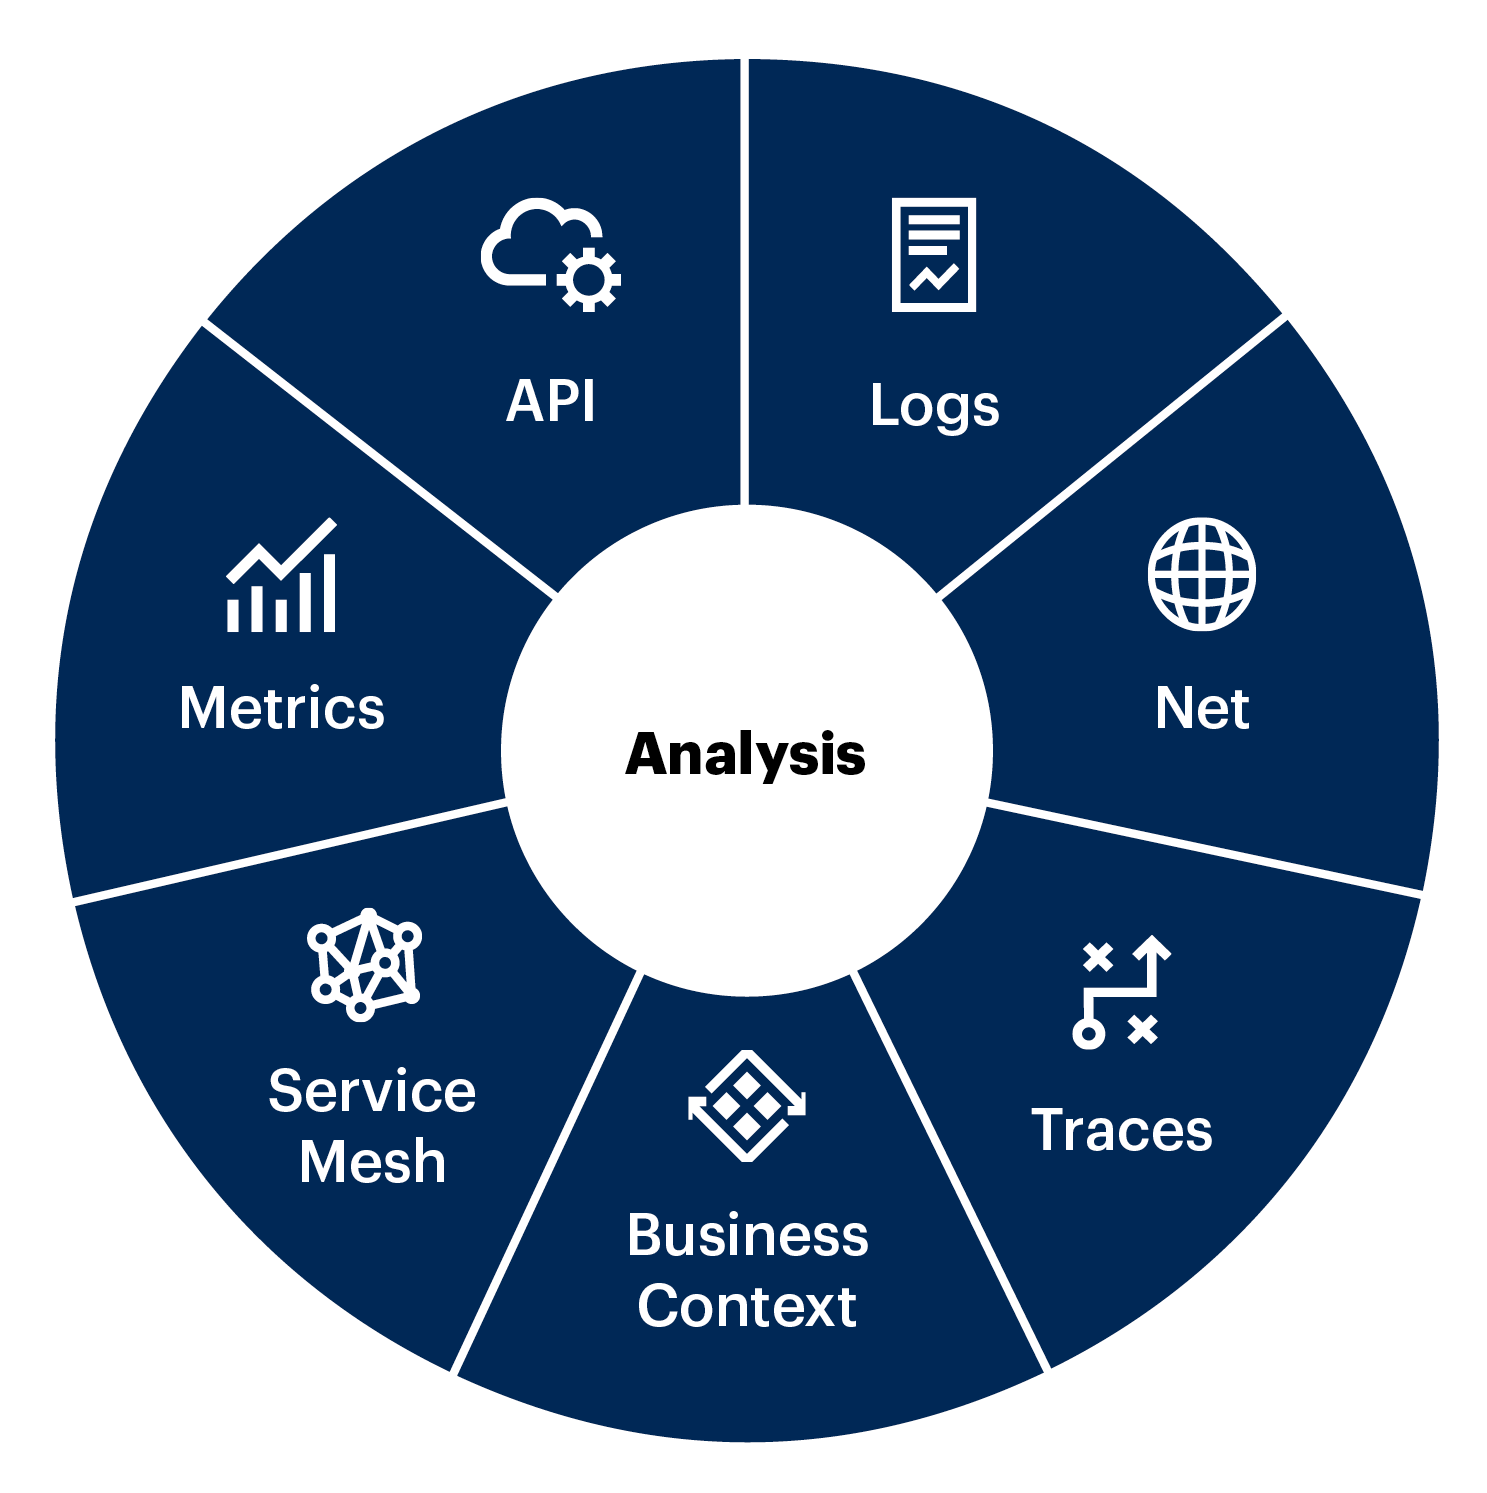
Gartner® Report: Prepare for the Future of Observability
AI and the surge in telemetry data are prompting I&O leaders to reevaluate their observability strategies. Learn what needs to evolve — and the steps leaders can take to build a more scalable and future-ready observability practice.

December 2024 Gartner Voice of the Customer: Observability Platforms
Grafana Labs was awarded a Customers’ ChoiceTM distinction in the December 2024 Voice of Customer: Observability Platforms report. Based on Gartner Peer Insight reviews, Grafana Labs scored a 92% overall.
For more information Read Gartner disclaimer
Gartner, Gartner Peer Insights ‘Voice of the Customer’: Observability Platforms, Peer Contributors, 24 December 2024. Gartner, Magic Quadrant for Observability Platforms, By Matt Crossley, Gregg Siegfried, Padraig Byrne, Andre Bridges, Martin Caren, 8 July 2025. Gartner, Critical Capabilities for Observability Platforms, By Matt Crossley, Gregg Siegfried, Padraig Byrne, Andre Bridges, Martin Caren, 8 July 2025.
Gartner is a registered trademark and service mark of Gartner, Inc. and/or its affiliates in the U.S. and internationally and is used herein with permission. All rights reserved. Magic Quadrant and Peer Insights are registered trademarks of Gartner, Inc. and/or its affiliates and are used herein with permission. All rights reserved. These graphics were published Gartner, Inc. as part of a larger research document and should be evaluated in the context of the entire document. The Gartner document is available upon request from Grafana Labs.
Gartner does not endorse any vendor, product or service depicted in this content nor makes any warranties, expressed or implied, with respect to this content, about its accuracy or completeness, including any warranties of merchantability or fitness for a particular purpose. Gartner does not endorse any vendor, product or service depicted in its research publications, and does not advise technology users to select only those vendors with the highest ratings or other designation. Gartner research publications consist of the opinions of Gartner’s research organization and should not be construed as statements of fact. Gartner disclaims all warranties, expressed or implied, with respect to this research, including any warranties of merchantability or fitness for a particular purpose.
Gartner and Peer Insights™ are trademarks of Gartner, Inc. and/or its affiliates. All rights reserved. Gartner Peer Insights content consists of the opinions of individual end users based on their own experiences, and should not be construed as statements of fact, nor do they represent the views of Gartner or its affiliates. Gartner Peer Insights Customers’ Choice constitute the subjective opinions of individual end-user reviews, ratings: and data applied against a documented methodology; they neither represent the views of, nor constitute an endorsement by, Gartner or its affiliates.
Resources to guide your observability strategy
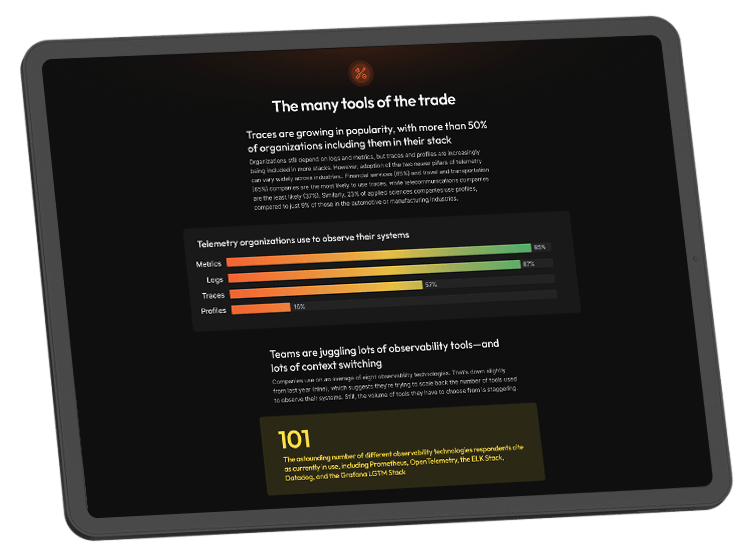
Observability Survey
More than 1,200 observability practitioners weighed in on the state of the industry, sharing thoughts on adoption and maturity, the sheer volume of tools in use, the lingering concerns about expenses, and the ubiquity of open source tools in this still-emerging market.
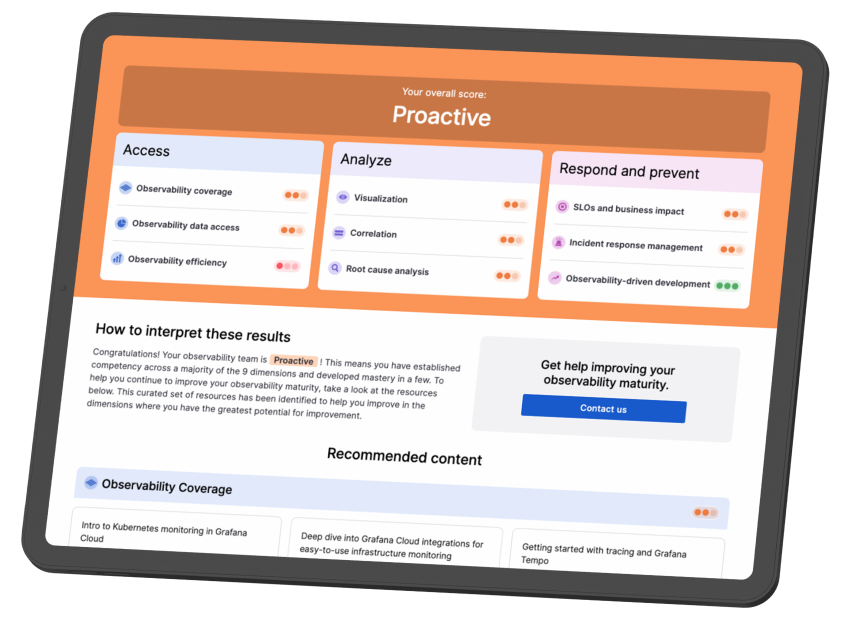
Observability Journey Maturity Model
Modern infrastructure and applications are complex and constantly evolving. Understand where your organization is on your observability journey and how to improve your maturity.
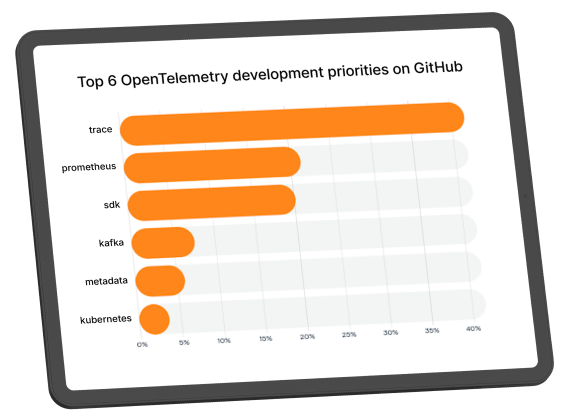
OpenTelemetry report
OpenTelemetry has emerged as a key player in the cloud native arena, aiming to streamline the increasingly complex field of cloud native observability. Here’s everything you need to know about the challenges, priorities, adoption patterns, and solutions.
Real-world perspectives on observability
Watch our ObservabilityCON leadership panel discussions on building observability at massive scale and what happens next.
Executive insights from Grafana Labs
Our senior leaders share their experiences, strategies for success, and perspectives on the evolving observability landscape.

Raj Dutt
Co-founder and CEO

Torkel Ödegaard
Co-founder and CGO

Tom Wilkie
CTO
Explore the full scope of our observability platform
Query /
keep data where it is

Send data to backends
Open standards: OTel, Prometheus
No lock-in
Open standards: OTel, Prometheus

Your tools / data
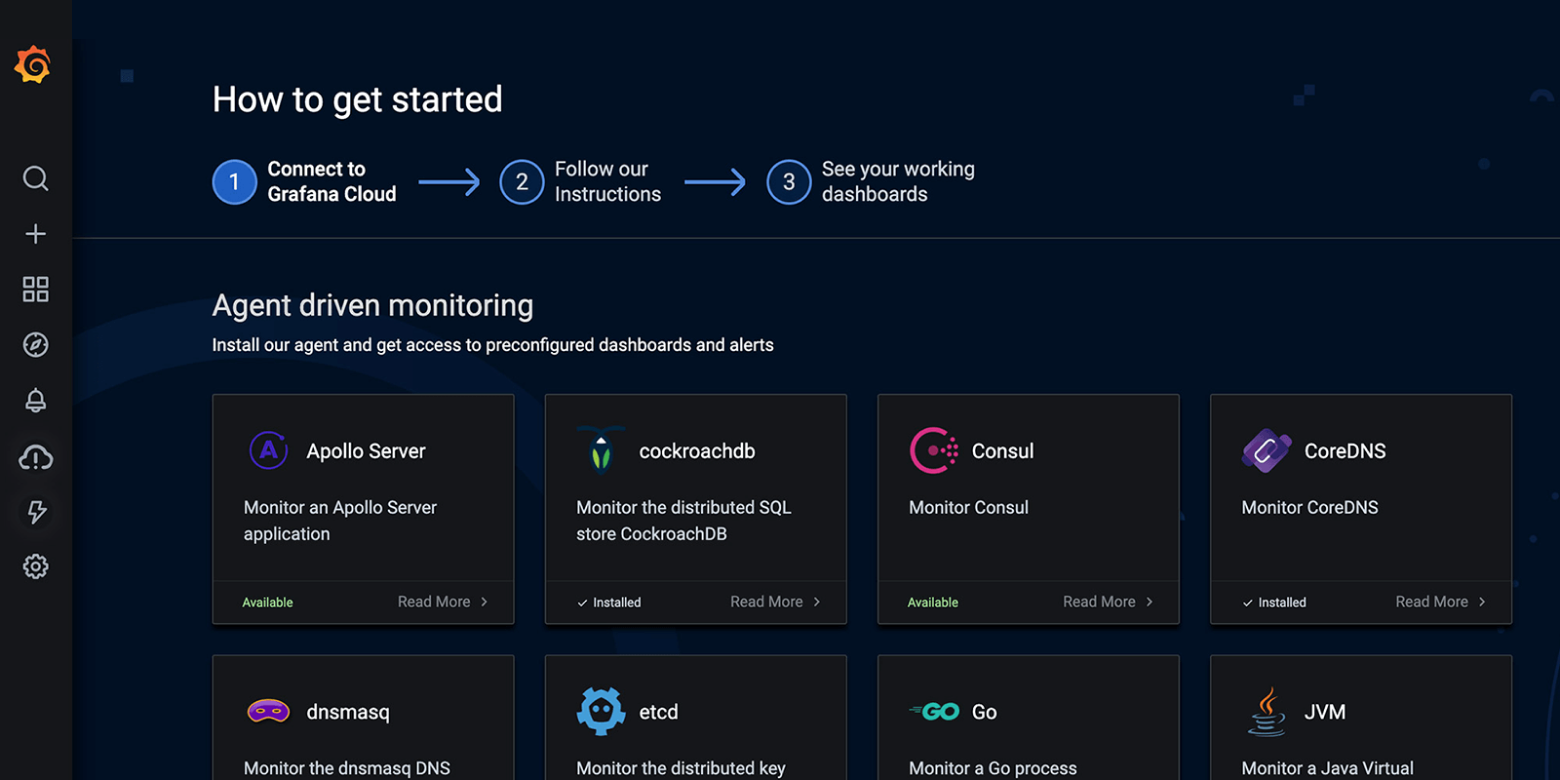
Connect your tools and your teams with Grafana plugins. Data source plugins hook into existing data sources via APIs and render the data in real time without requiring you to migrate or ingest your data.
Your environment
Send your local data to Grafana’s backend for long-term storage, aggregation, and high-performance querying. Forward your metrics, logs, traces, and profiles using existing services deployed into your environment.
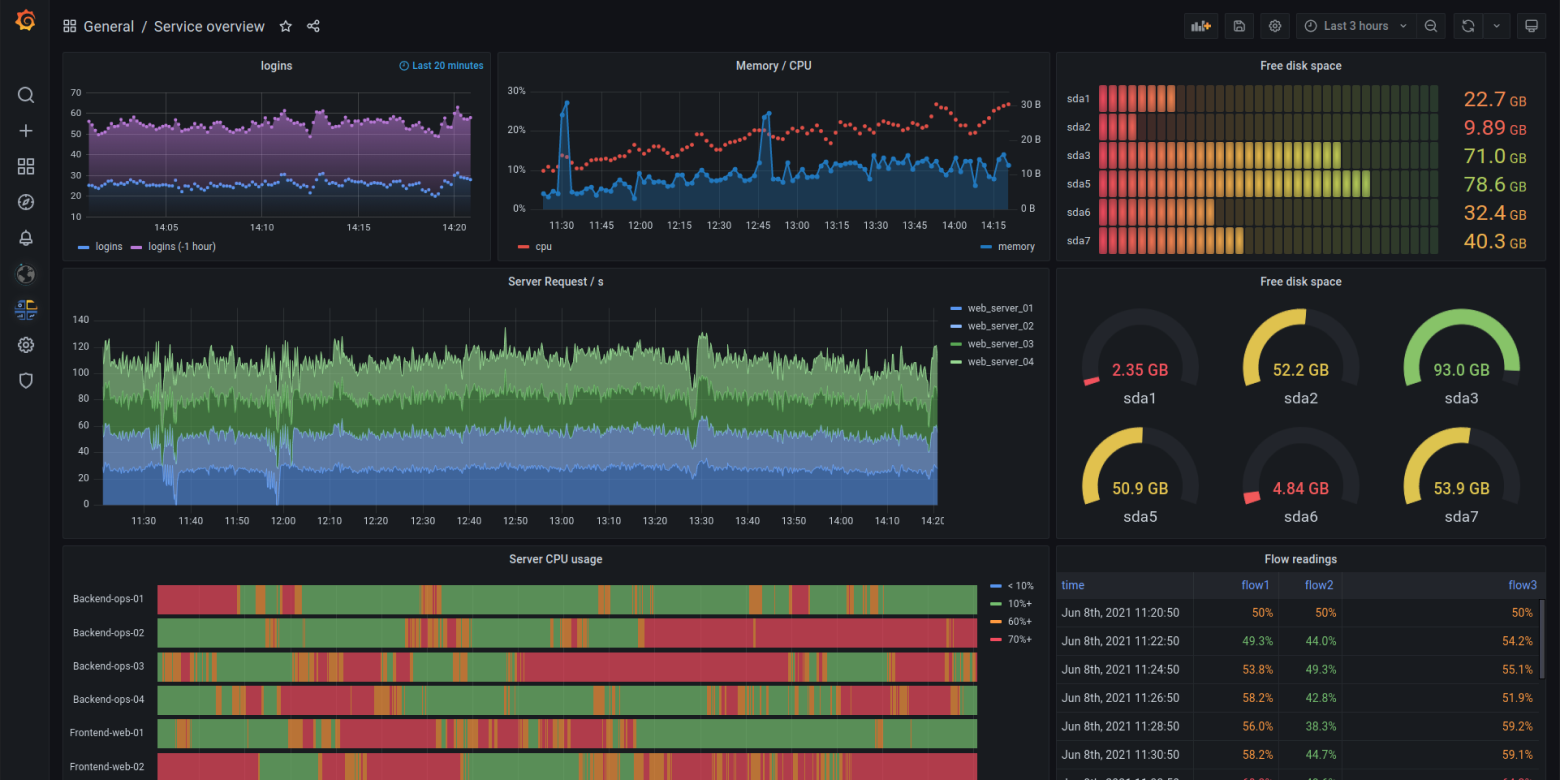
Visualization
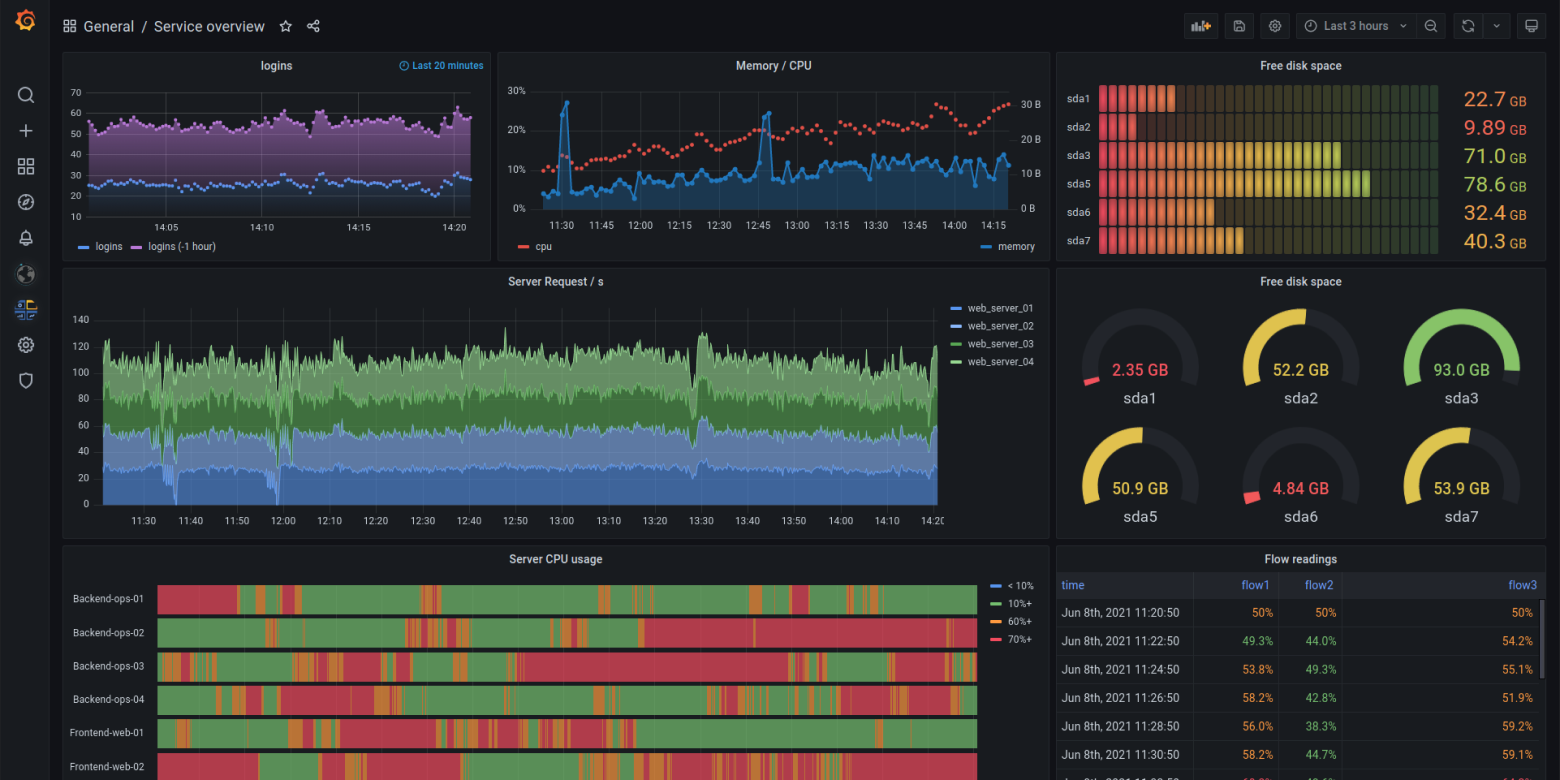
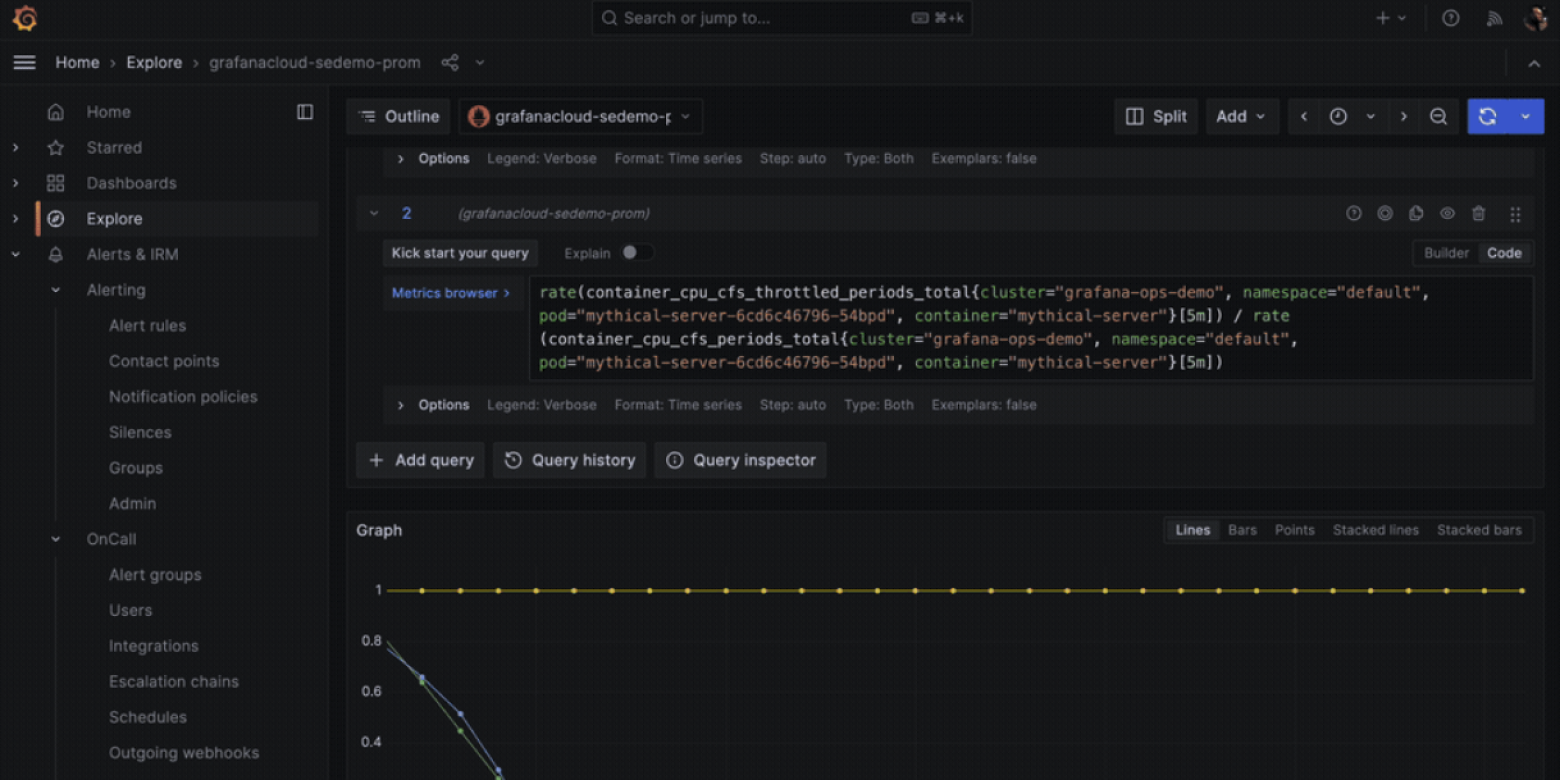
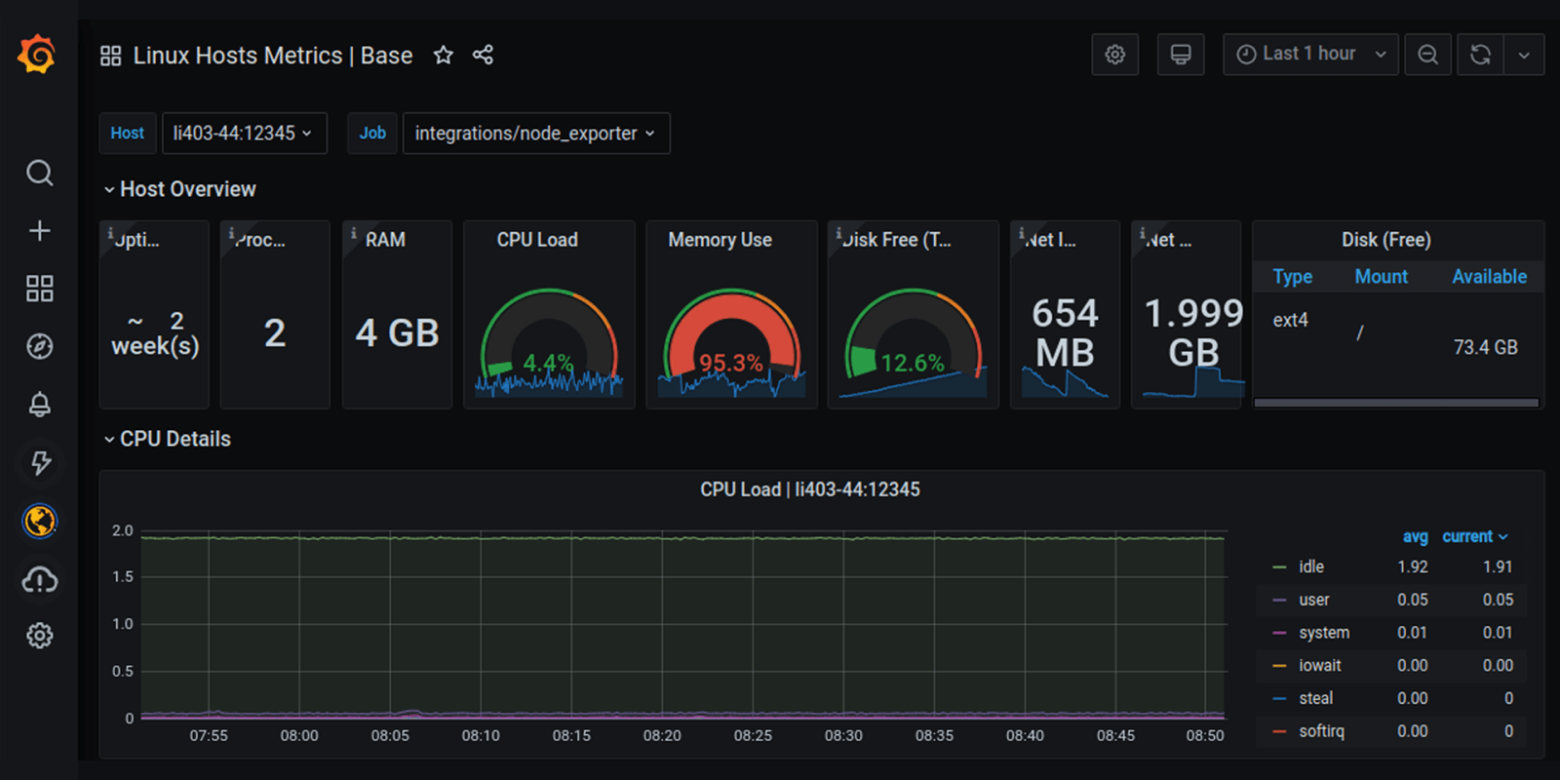
Grafana allows you to query, visualize, alert on, and understand your metrics no matter where they are stored. Create, explore, and share beautiful dashboards with your team and foster a data-driven culture.
Performance testing
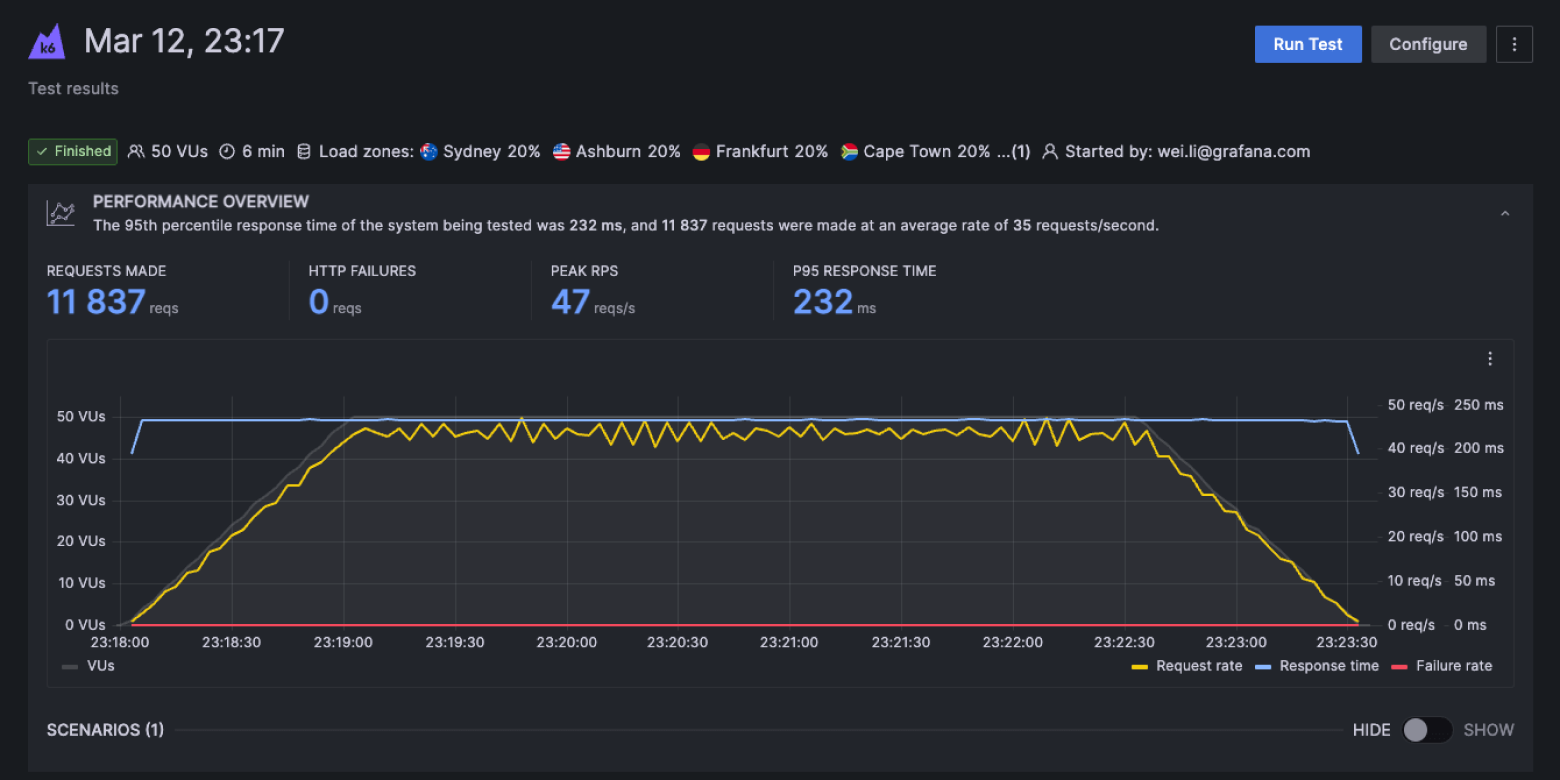
Easily run cloud-based performance tests to boost release confidence and velocity.
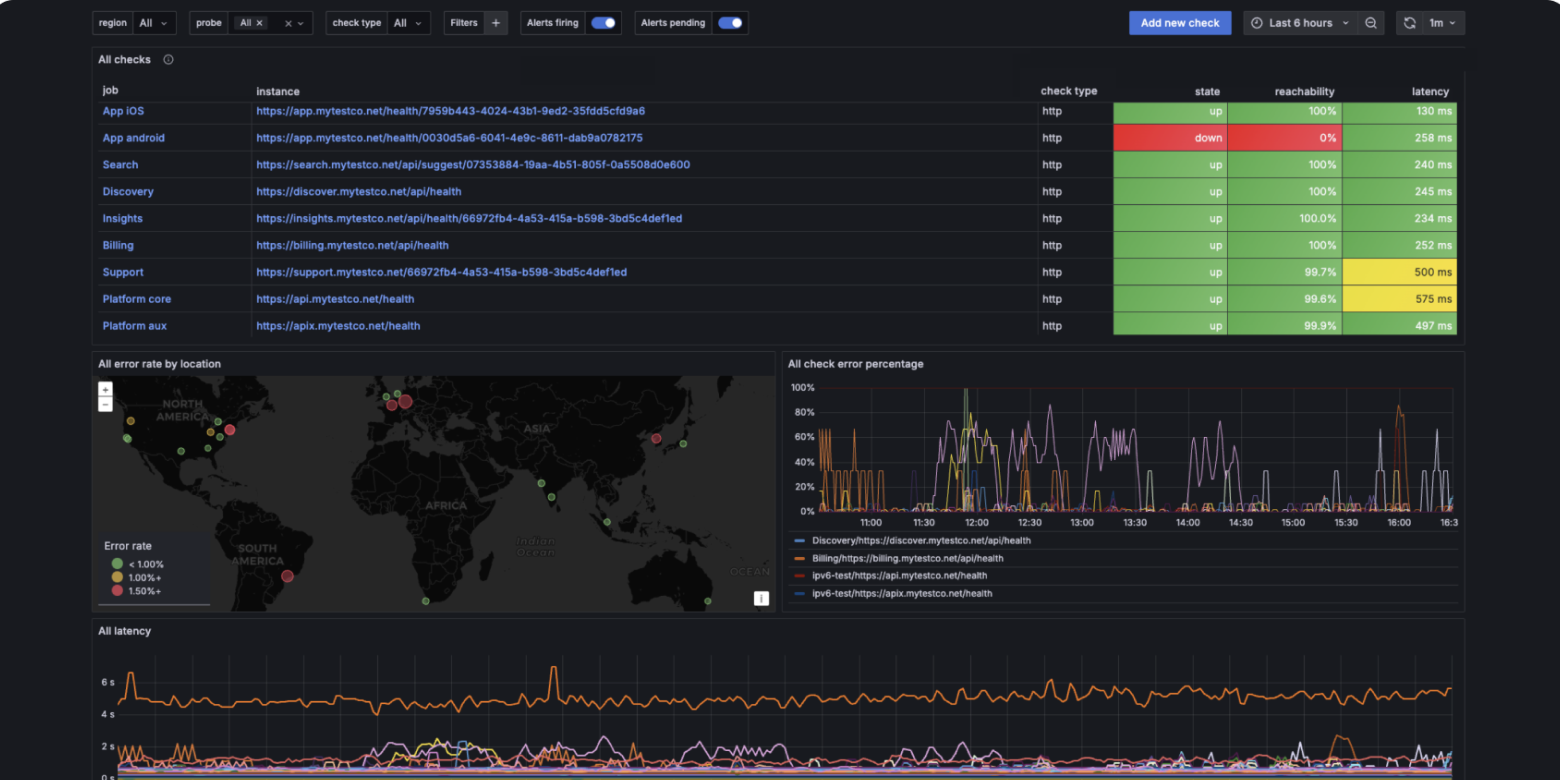
Synthetic monitoring
Proactively monitor the performance of your APIs and web applications from the user’s perspective, testing the availability, health, and quality of your services around the world.
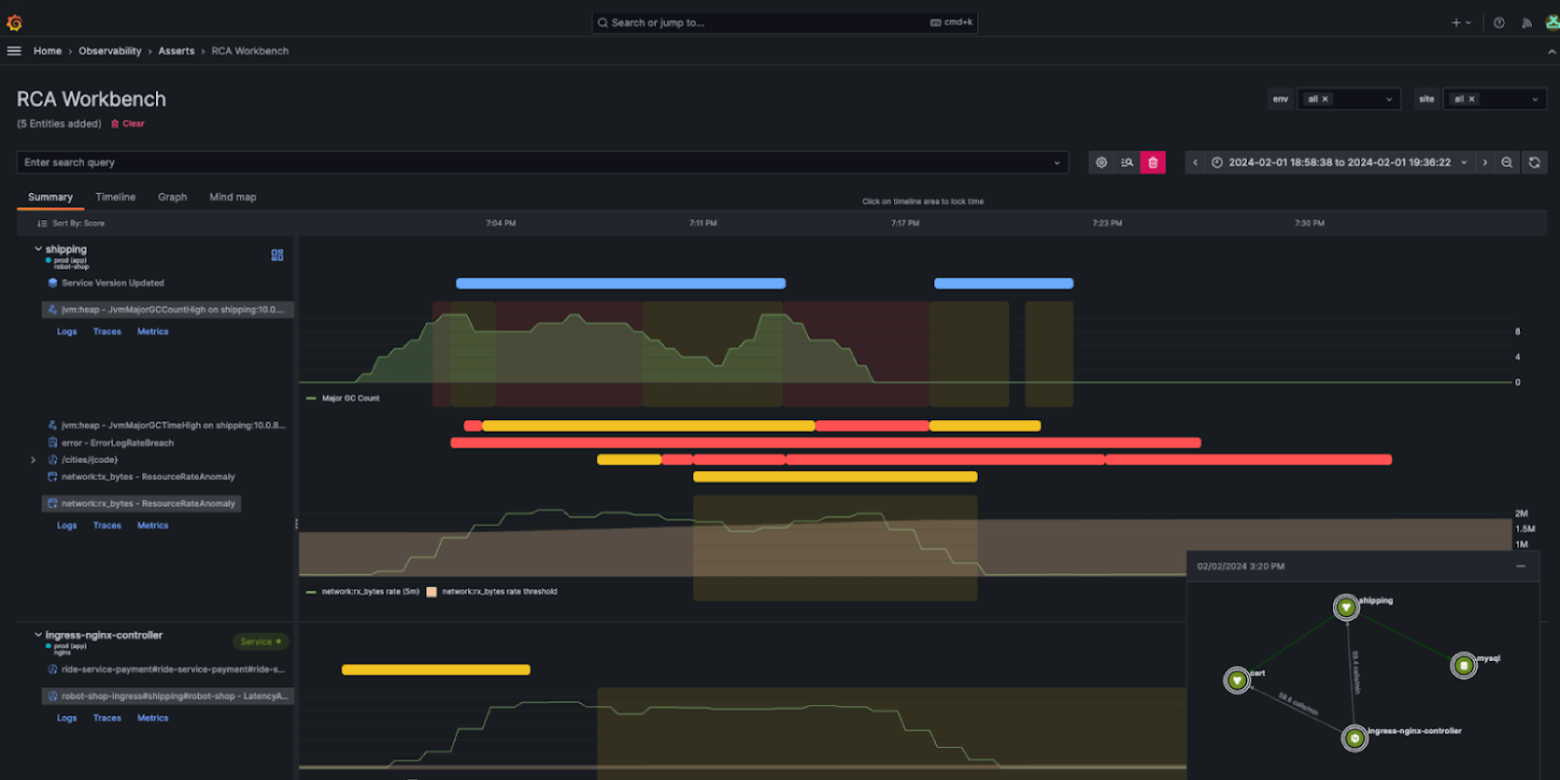
Contextualized Root Cause Analysis
Add an intelligence layer to your telemetry data to better understand the behavior of your applications and services. Uncover root causes quickly as related issues are automatically correlated.
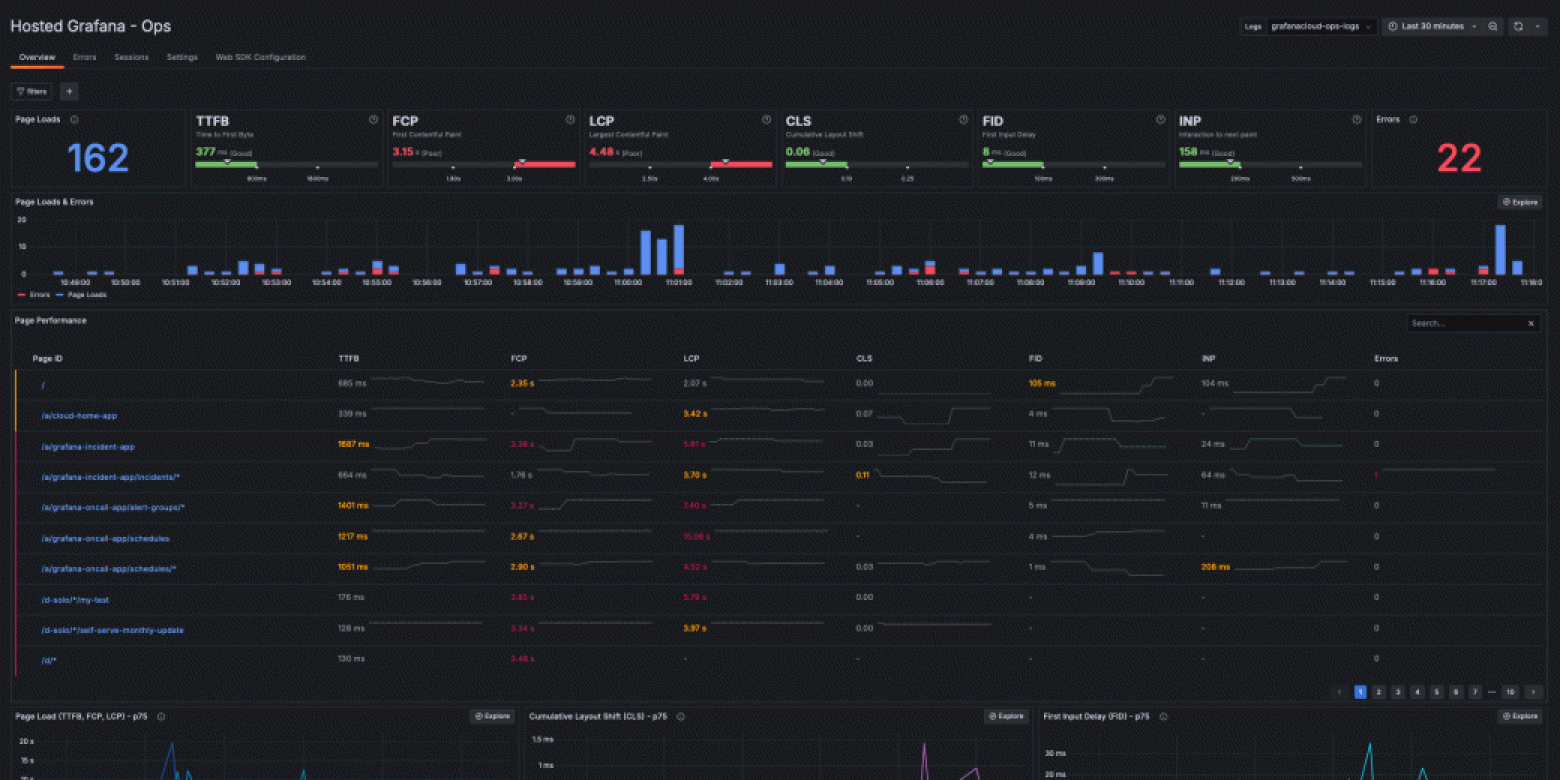
Frontend Observability
Gain clear, actionable insights into the end user experience of web applications with data on real-time frontend health and frontend errors.
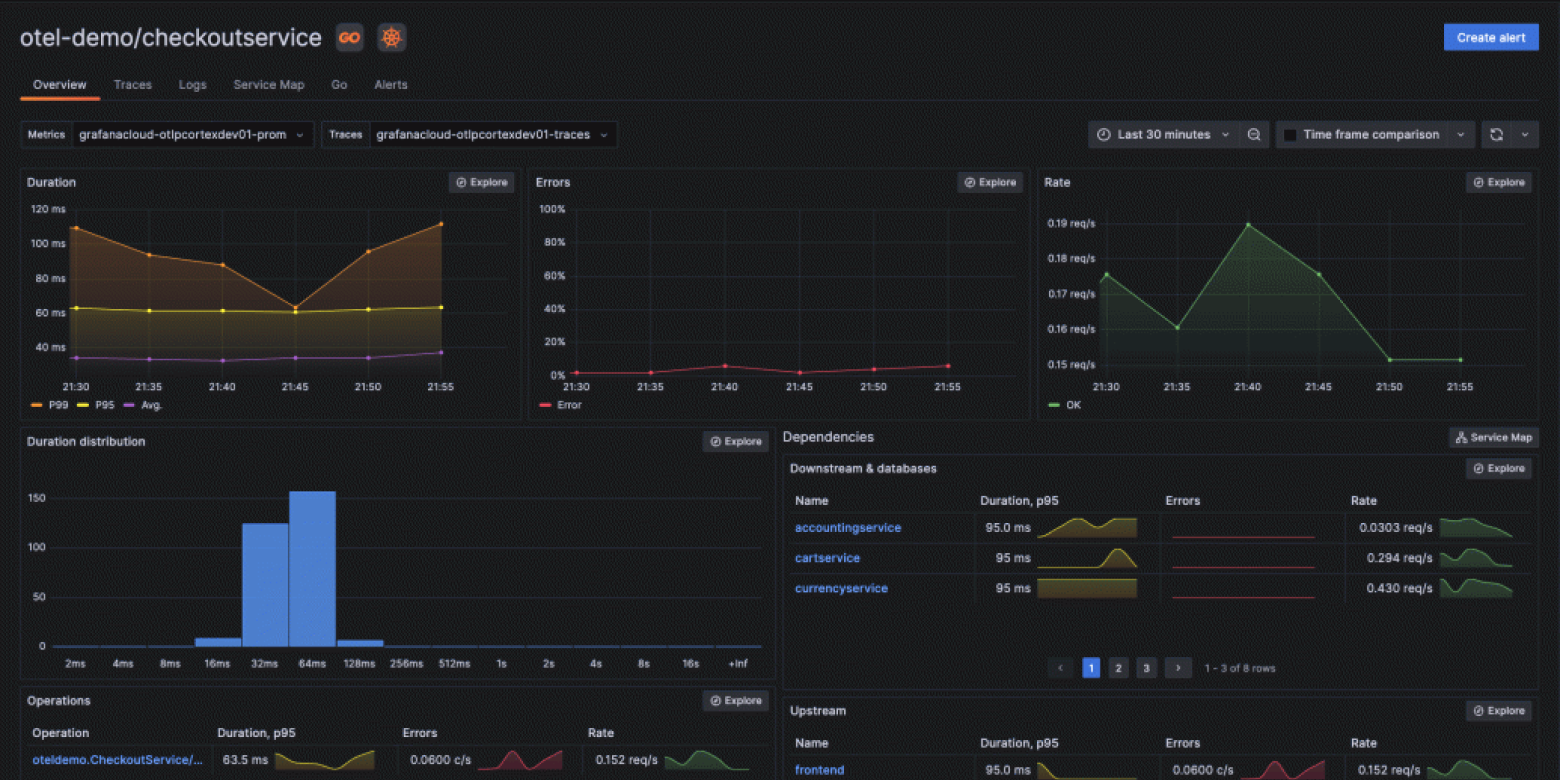
Application Observability
Bring together application telemetry from the frontend and infrastructure layers with native support of both OpenTelemetry and Prometheus.
Infrastructure observability
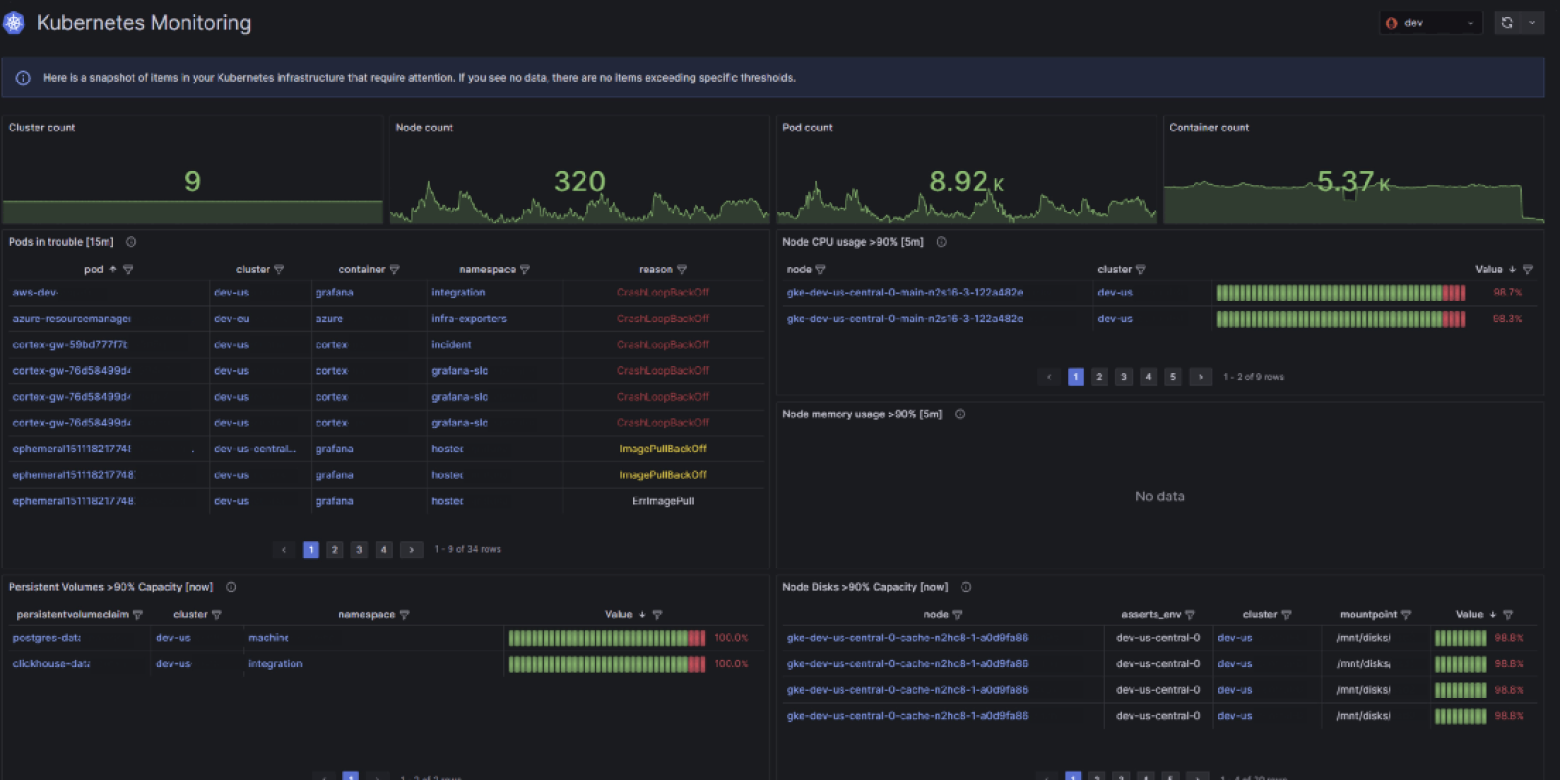
Gain insights into workloads you haven’t been able to see before with pre-built infrastructure observability solutions.
SLO management
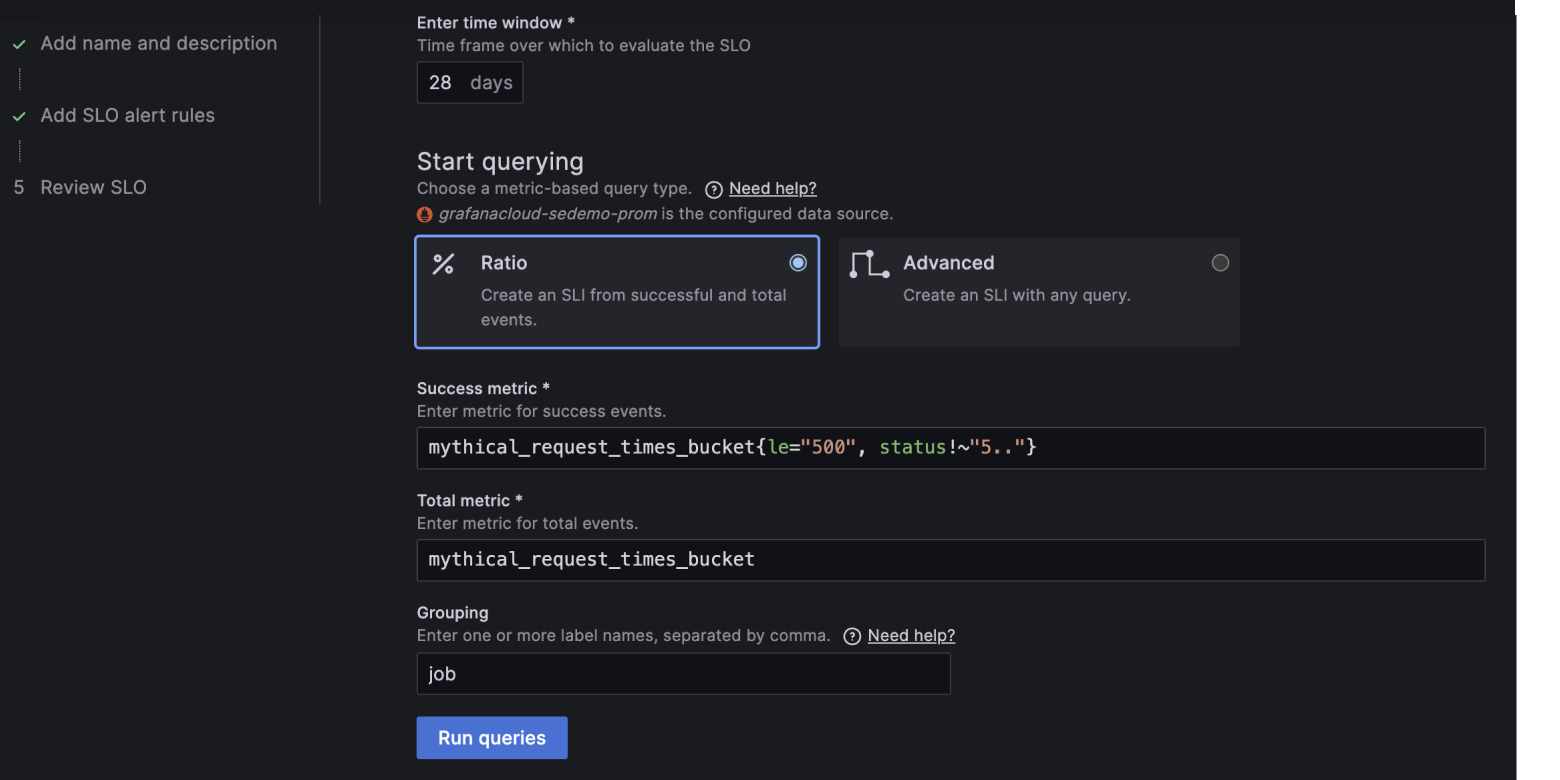
Easily create, manage, and scale service level objectives, SLO dashboards, and error budget alerts in Grafana Cloud.
Alerting
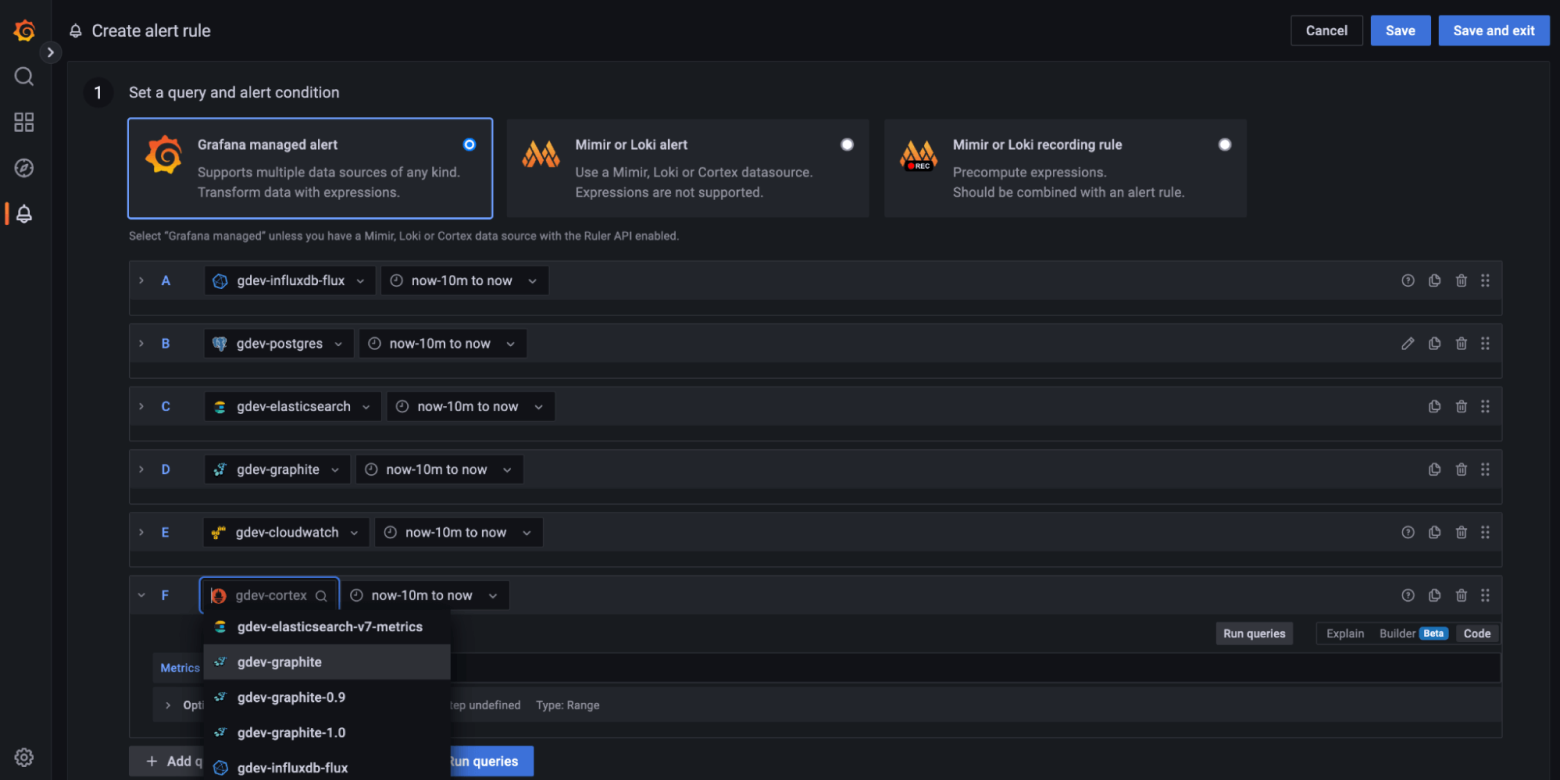
Create, manage, and take action on your alerts in a single, consolidated view, and improve your team’s ability to identify and resolve issues quickly.
On-call management
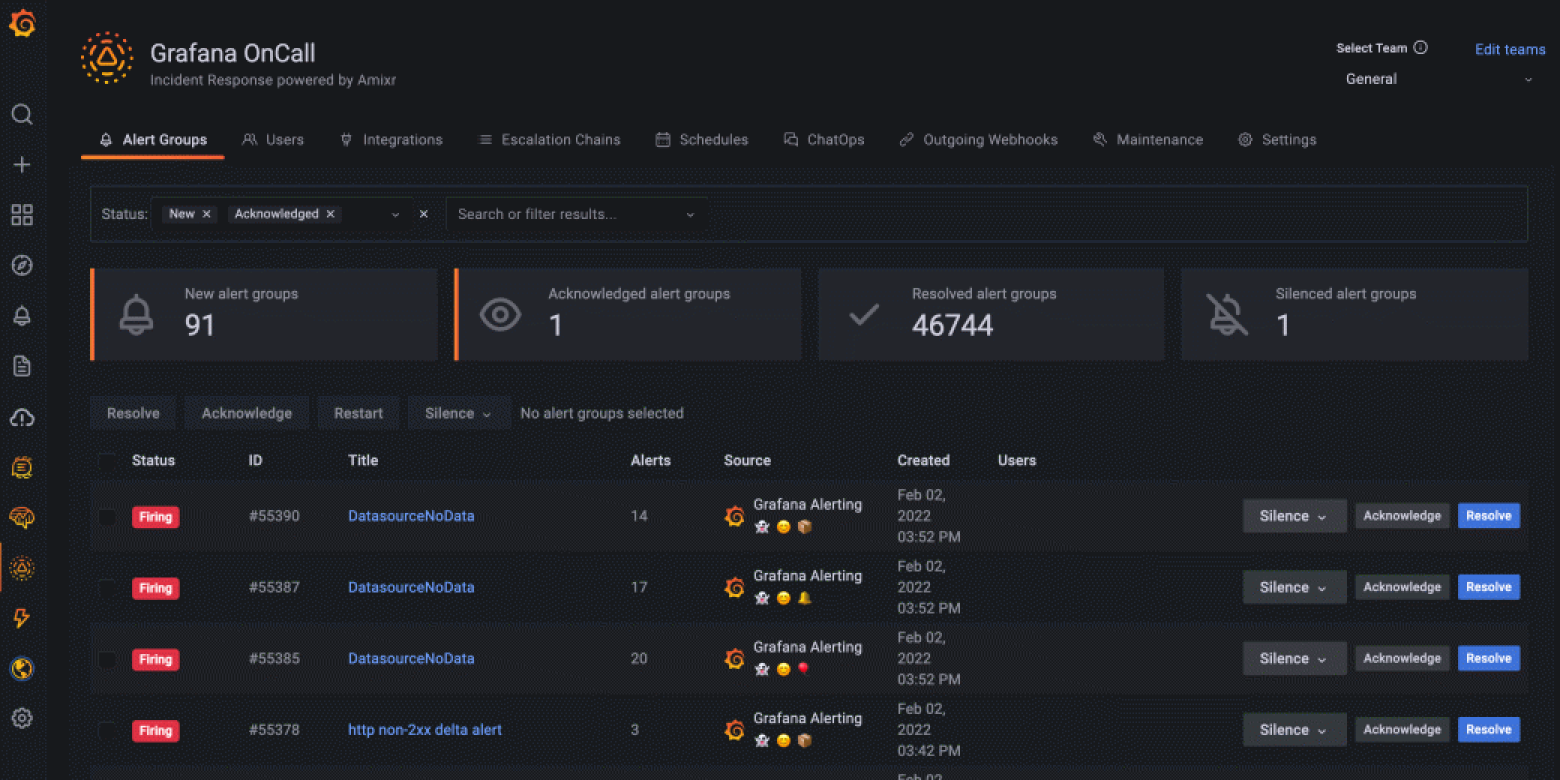
Reduce toil in on-call management through simpler workflows and interfaces that are tailored specifically for engineers.
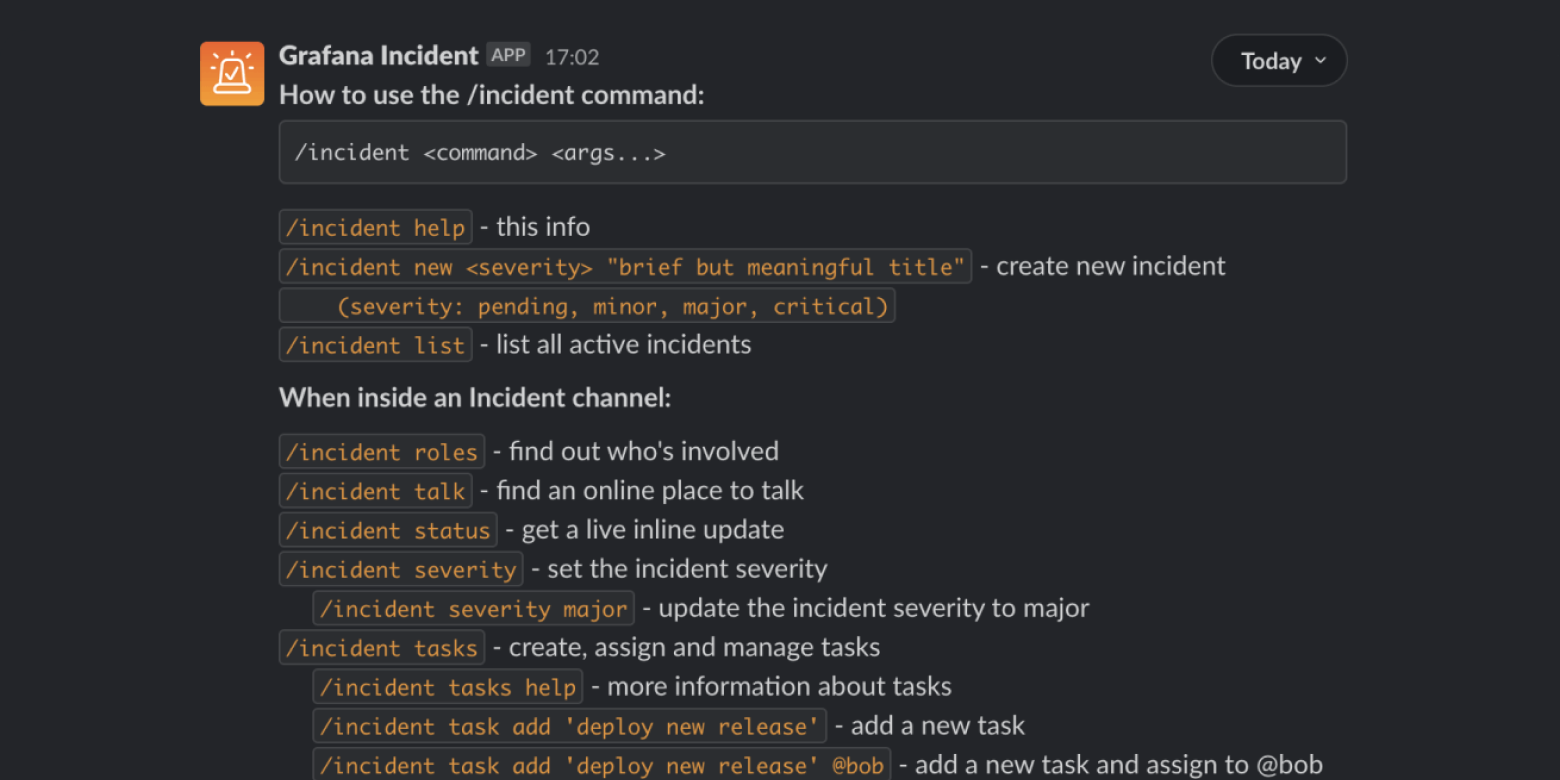
Incident management
Respond to incidents faster by automating the toilsome tasks of incident management, which helps you focus on actually fixing the issue.
AI insights
AI tools in Grafana Cloud minimize toil and the need for everyone in your organization to have the same deep domain knowledge about your increasingly complex stack.
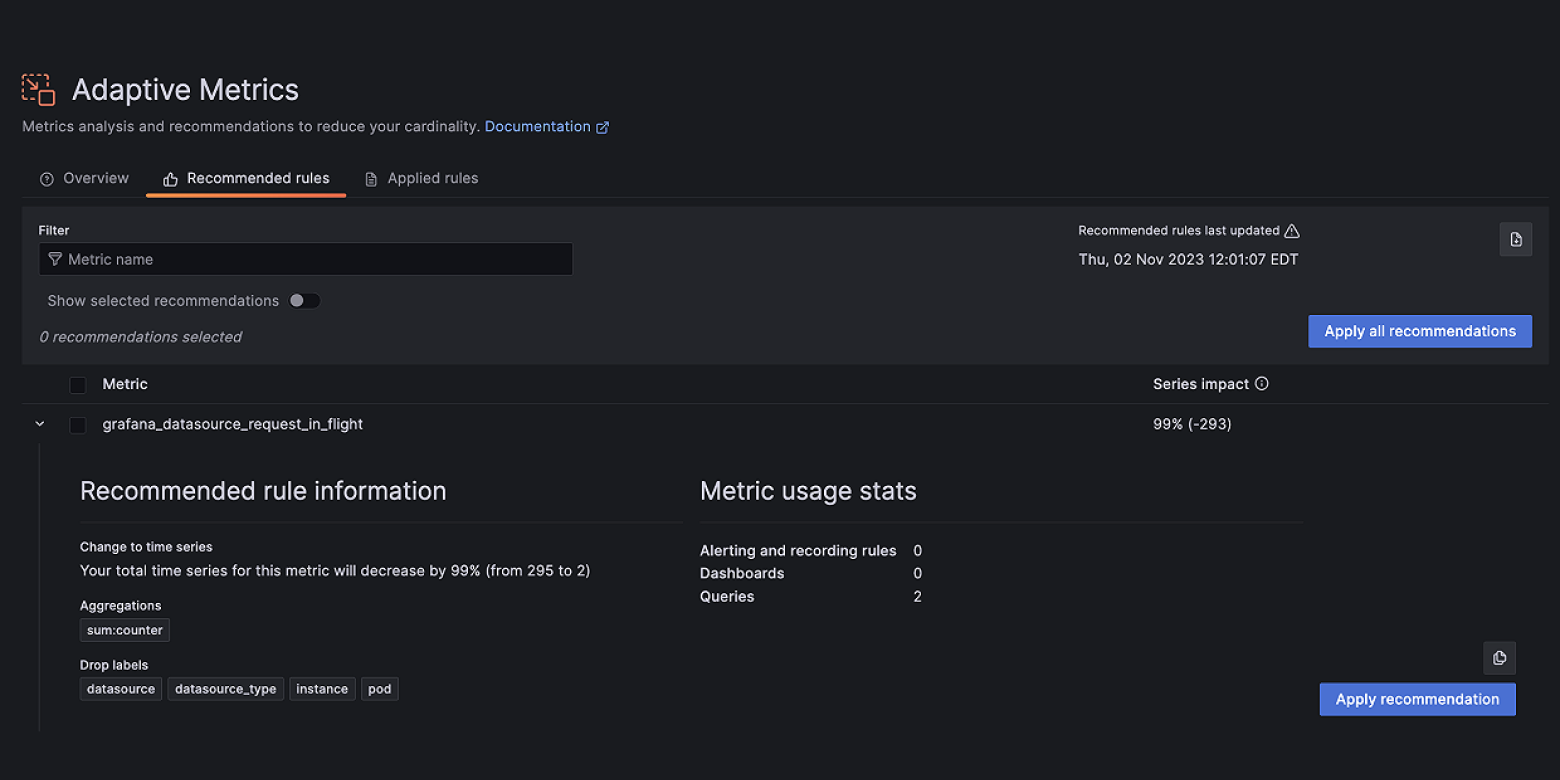
Cost management
Manage, control, and optimize your observability spend with a centralized suite of tools in Grafana Cloud.
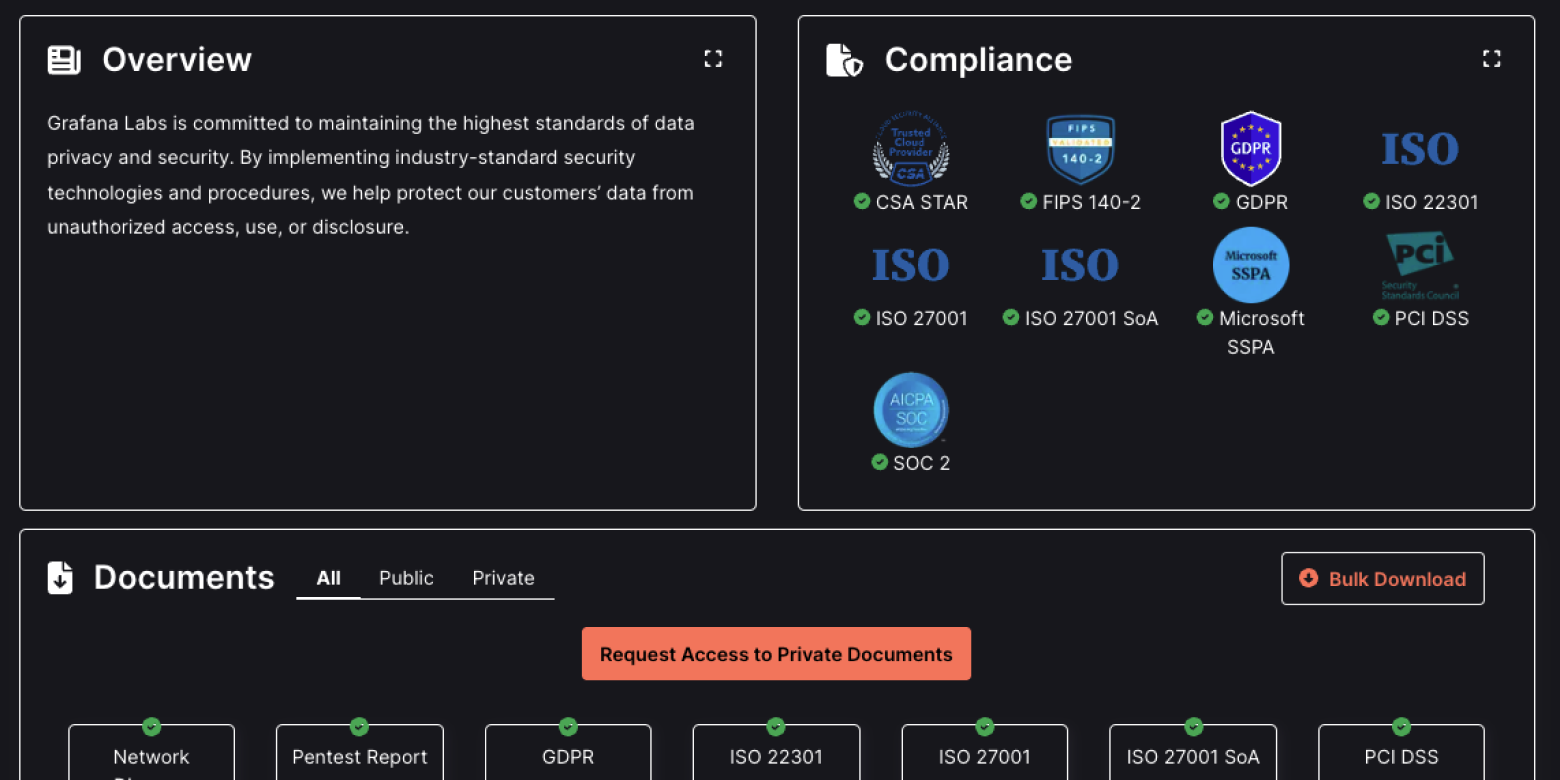
Security and governance
Grafana's security and governance capabilities include robust user authentication and authorization, data source permissions, audit logging, and compliance with industry standards to ensure secure and controlled access to data visualizations and dashboards.
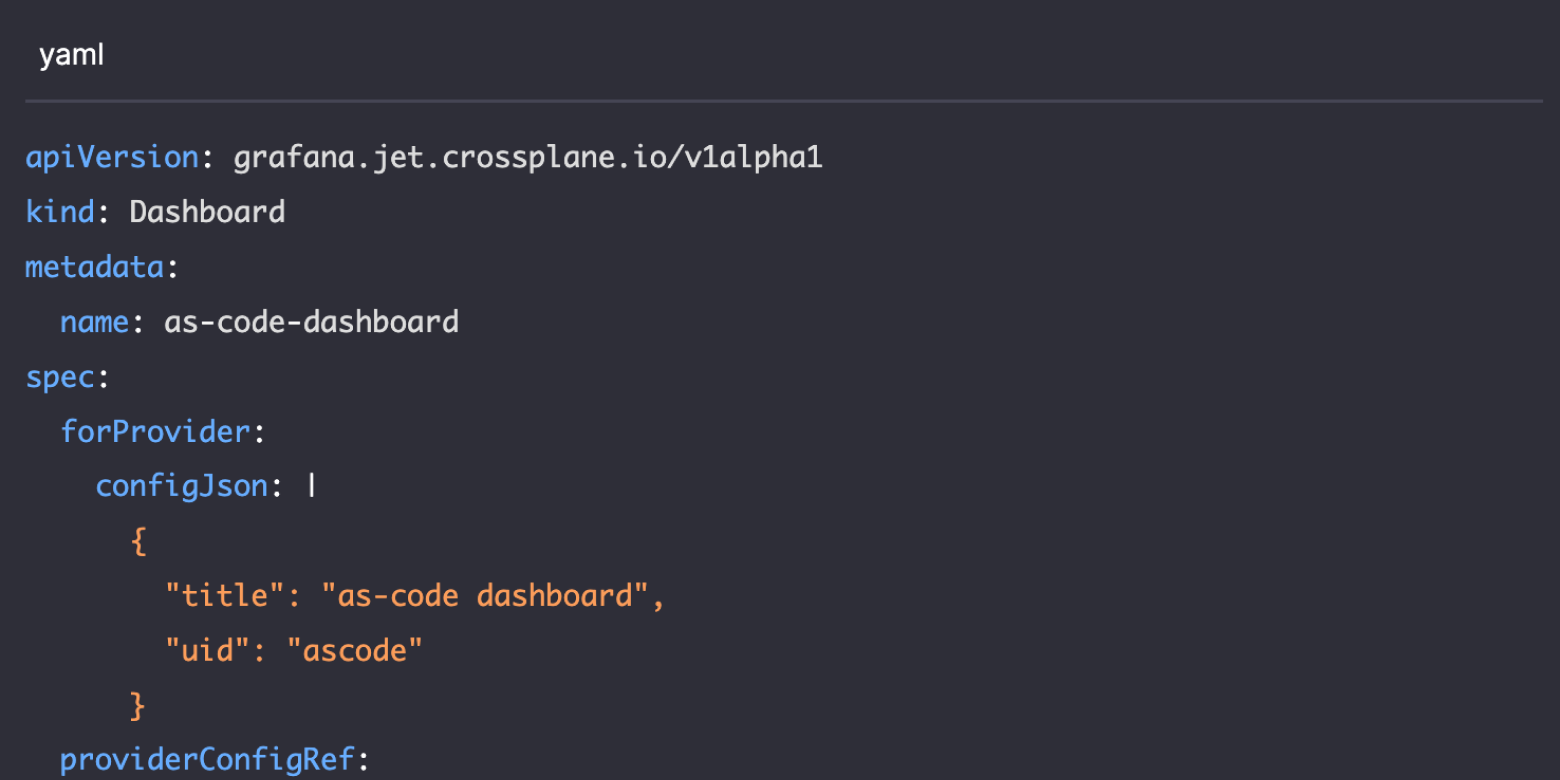
Configuration (as code)
Manage dashboards, datasources, and configurations through declarative JSON or YAML files, enabling version control and automated deployments for consistent and reproducible monitoring environments.
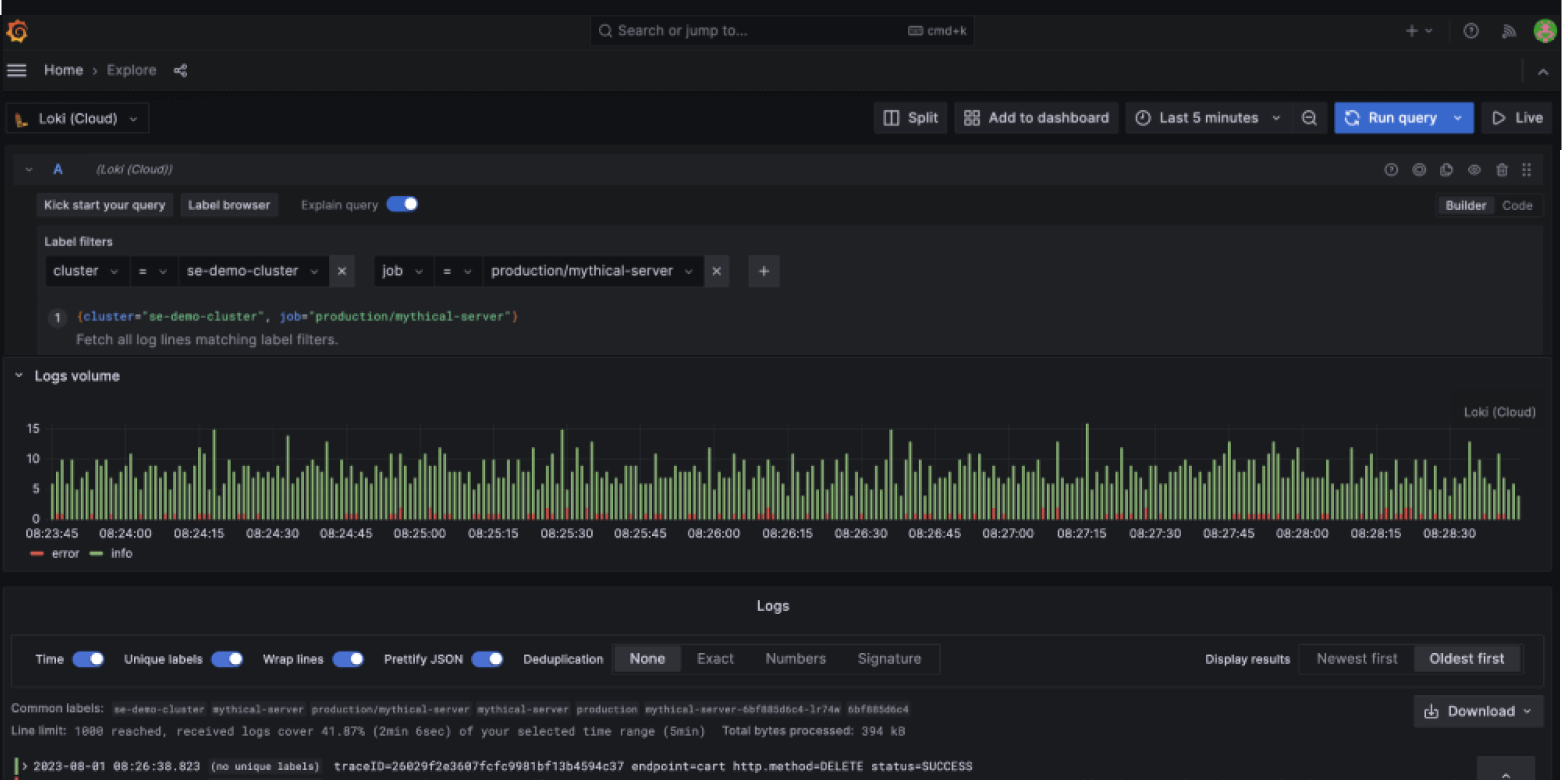
Loki
Store and query logs from all your applications and infrastructure – without worrying about log volumes, costs, or storage limits.
Grafana
Query, visualize, alert on, and understand your metrics no matter where they are stored. Create, explore, and share beautiful dashboards with your team and foster a data-driven culture.
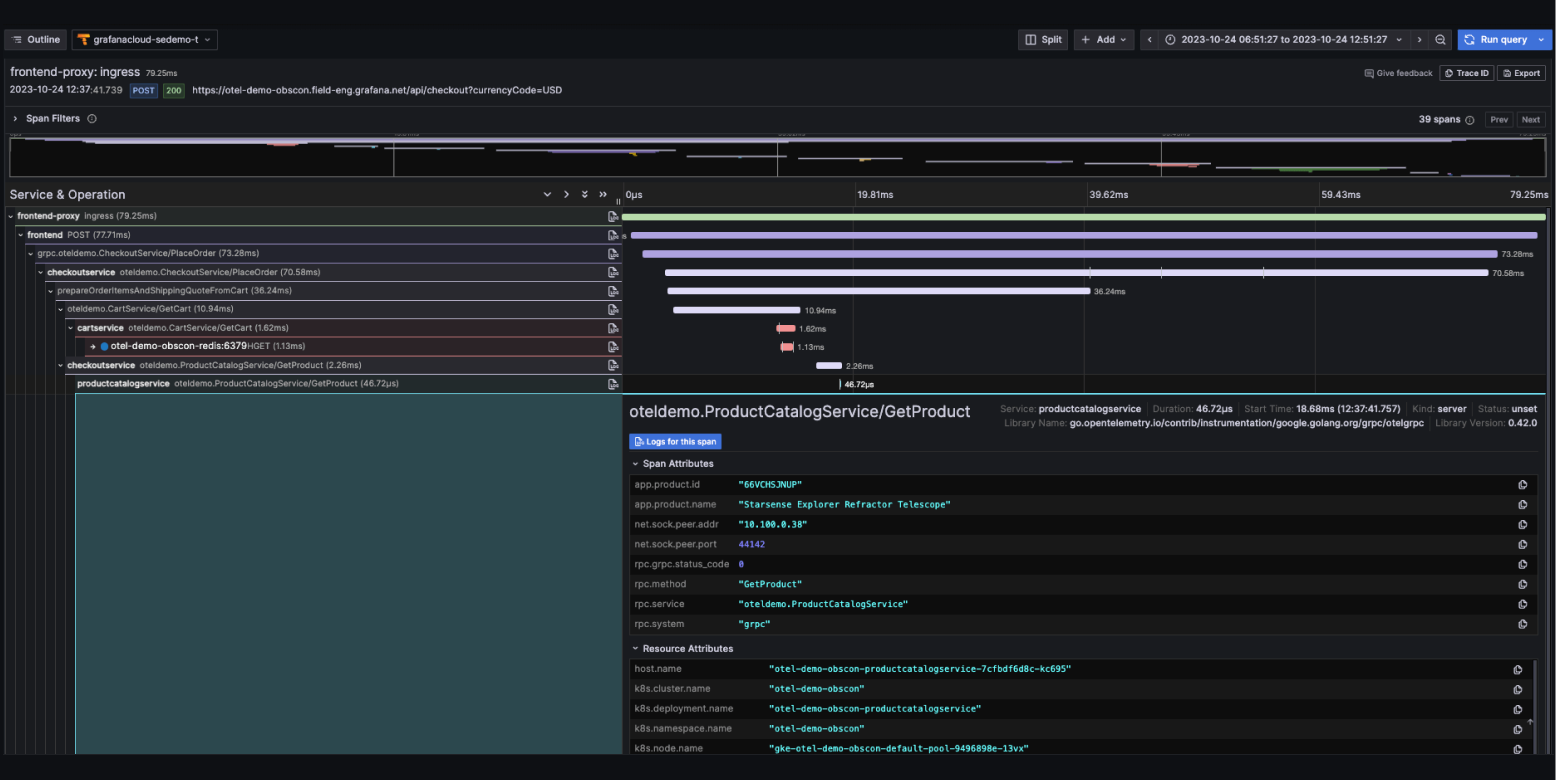
Tempo
Understand the flow of requests and data in your software systems and track down issues quickly with this highly scalable, cost-effective trace storage and query engine.
Mimir
Bring together the raw, unsampled metrics for all your applications and infrastructure, spread around the globe, in one place. Query high-cardinality data with blazing fast PromQL and Graphite queries.
Pyroscope
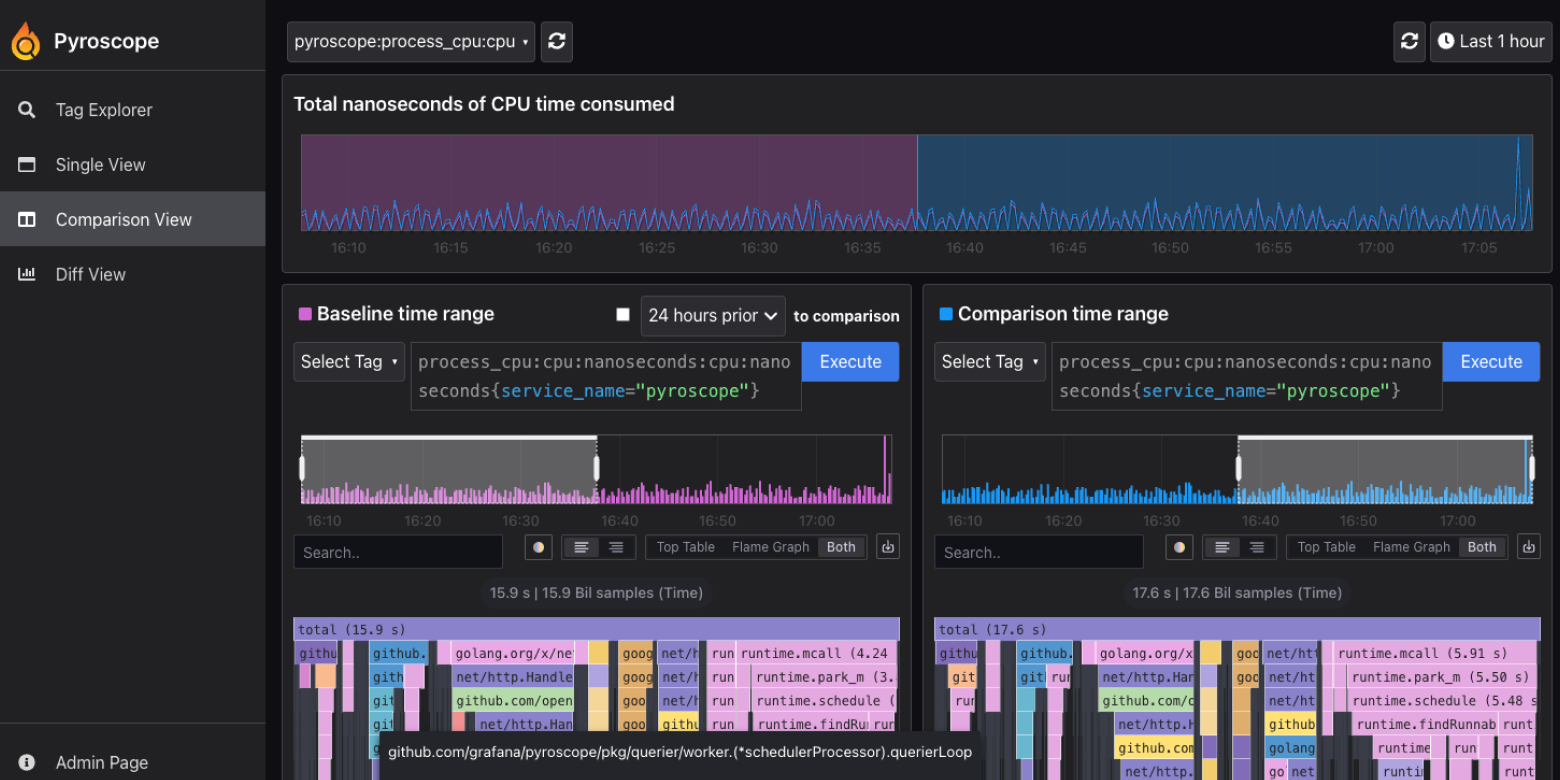
Optimize infrastructure spend, simplify debugging, and enhance application performance through continuous profiling.
Try Grafana Cloud
Enable comprehensive observability without the overhead of building and maintaining your own stack.
Get started with our actually useful free tier.
Get in touch
We’re friendly people and like to help. If you would prefer to contact us directly, email info@grafana.com.

