
Plugins 〉Compass


Compass


Compass Panel


Overview / Introduction
Compass is a Grafana visualization plugin for displaying heading or orientation data on a compass dial.
It is especially useful for ship navigation, robotics, UAVs, or any time-series data representing direction in degrees (0–360).
Optionally the panel can display true and/or apparent wind angle.

Features
- Smoothly animated compass dial that rotates with heading values.
- Multiple needle types:
- Default: classic north/south needle with red tip.
- Arrow: bold arrow-style needle.
- Ship: minimal ship silhouette pointing forward.
- Custom SVG: load your own vector as a needle.
- Custom PNG: load your own bitmap as a needle.
- Cardinal direction labels (N/E/S/W).
- Configurable colors for bezel, dial, text, needle, and tail.
- Minor and major tick marks for easy orientation.
- Optional numeric heading readout (e.g.
273°). - Optional indicator and numeric heading for true wind direction.
- Optional indicator and numeric heading for apparent wind direction.
- Optional numeric display for true wind speed.
- Optional numeric display for apparent wind speed.
Getting Started
- Install the plugin by copying it into Grafana’s plugin directory or installing from the Grafana Marketplace.
- Restart Grafana.
- Add a new panel and select Compass as the visualization.
- Configure the data source and select the field representing heading (0–360 degrees).
Options
Data Options
- Heading Field: Select the numeric field in your series that represents heading in degrees.
- Truewind Direction Field: Select the numeric field in your series that represents truewind direction in degrees.
- Truewind Velocity Field: Select the numeric field in your series that represents truewind velocity in degrees.
- Apparent wind Direction Field: Select the numeric field in your series that represents apparent wind direction in degrees.
- Apparent wind Velocity Field: Select the numeric field in your series that represents apparent wind velocity in degrees.
Display Options
- Show Labels: Toggle cardinal direction labels (N/E/S/W).
- Show Numeric Heading: Display a numeric degree readout below the compass.
- Truewind Velocity UOM: Select the unit of measure for the truewind.
- Apparent wind Velocity UOM: Select the unit of measure for the apparent wind.
- Rotation Mode: Select to rotate the needle (North up) or rotate the dial (Bow up).
Needle Options
Needle Type
Default– Red-tipped classic compass needleArrow– Stylized arrow needleShip– Simplified vessel silhouette (points to heading)SVG– Load a custom vector (provide URL or relative path)PNG– Load a custom image (provide URL or relative path)
Needle Color: Color of the primary needle.
Tail Color: Color of the tail (for default needle).
Custom SVG: Path/URL to your own SVG asset.
Custom PNG: Path/URL to your own PNG asset.
Colors
- Dial Color – Background color of compass dial.
- Bezel Color – Color of outer rim.
- Text Color – Color of labels, ticks, numeric heading.
- True Wind Color: Color of the true wind indicator and labels.
- Apparent Wind Color: Color of the apparent wind indicator and labels.
Screenshots
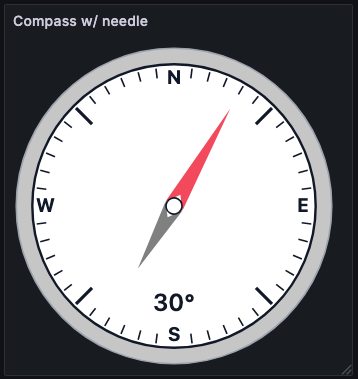
Arrow needle with labels and numeric heading enabled
![]()
Arrow needle with labels and numeric heading enabled
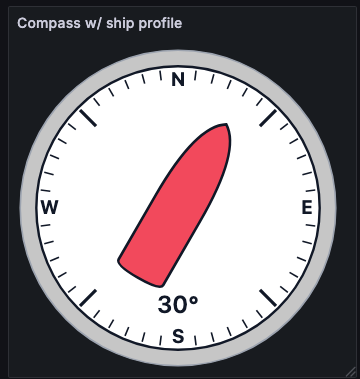
Ship silhouette needle for vessel heading visualization
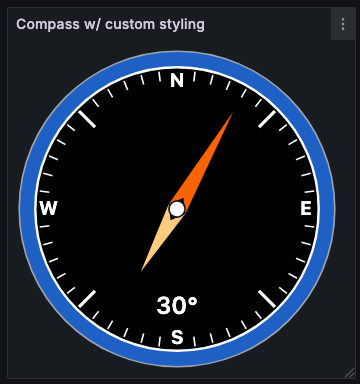
Standard needle compass with custom styling
North up orientation for wind indicator visualization

Bow up orientation for wind indicator visualization
Grafana Cloud Free
- Free tier: Limited to 3 users
- Paid plans: $55 / user / month above included usage
- Access to all Enterprise Plugins
- Fully managed service (not available to self-manage)
Self-hosted Grafana Enterprise
- Access to all Enterprise plugins
- All Grafana Enterprise features
- Self-manage on your own infrastructure
Installing Compass on Grafana Cloud:
Installing plugins on a Grafana Cloud instance is a one-click install; same with updates. Cool, right?
Note that it could take up to 1 minute to see the plugin show up in your Grafana.
Warning
Plugin installation from this page will be removed in February 2026. Use the Plugin Catalog in your Grafana instance instead. Refer to Install a plugin in the Grafana documentation for more information.
Installing plugins on a Grafana Cloud instance is a one-click install; same with updates. Cool, right?
Note that it could take up to 1 minute to see the plugin show up in your Grafana.
Installing plugins on a Grafana Cloud instance is a one-click install; same with updates. Cool, right?
Note that it could take up to 1 minute to see the plugin show up in your Grafana.
Warning
Plugin installation from this page will be removed in February 2026. Use the Plugin Catalog in your Grafana instance instead. Refer to Install a plugin in the Grafana documentation for more information.
Installing plugins on a Grafana Cloud instance is a one-click install; same with updates. Cool, right?
Note that it could take up to 1 minute to see the plugin show up in your Grafana.
For more information, visit the docs on plugin installation.
Installing on a local Grafana:
For local instances, plugins are installed and updated via a simple CLI command. Plugins are not updated automatically, however you will be notified when updates are available right within your Grafana.
1. Install the Panel
Use the grafana-cli tool to install Compass from the commandline:
grafana-cli plugins install The plugin will be installed into your grafana plugins directory; the default is /var/lib/grafana/plugins. More information on the cli tool.
Alternatively, you can manually download the .zip file for your architecture below and unpack it into your grafana plugins directory.
Alternatively, you can manually download the .zip file and unpack it into your grafana plugins directory.
2. Add the Panel to a Dashboard
Installed panels are available immediately in the Dashboards section in your Grafana main menu, and can be added like any other core panel in Grafana.
To see a list of installed panels, click the Plugins item in the main menu. Both core panels and installed panels will appear.
Changelog
1.0.0
Initial release.
2.0.0
Added wind direction indicators/labels
2.1.0
Added wind velocity labels
2.1.1
Updated links on README pages
2.1.2
Updated "No data" behaviors Biased png needle image to better indicate which end of the needle is the front.
2.1.3
Fixed: Apparent wind angle corrently displays relative to the vessel heading and NOT the compass dial.