Plugins 〉Plotly


Plotly


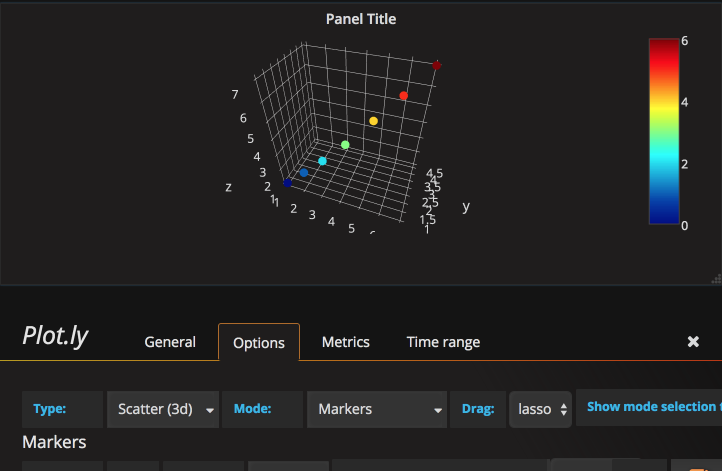
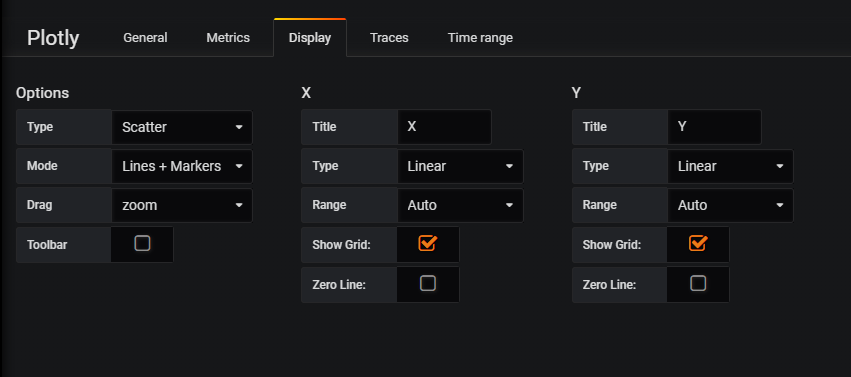
Plot.ly Panel for Grafana


Render metrics using the plot.ly javascript framework
Works with grafana 4, 5, and 6
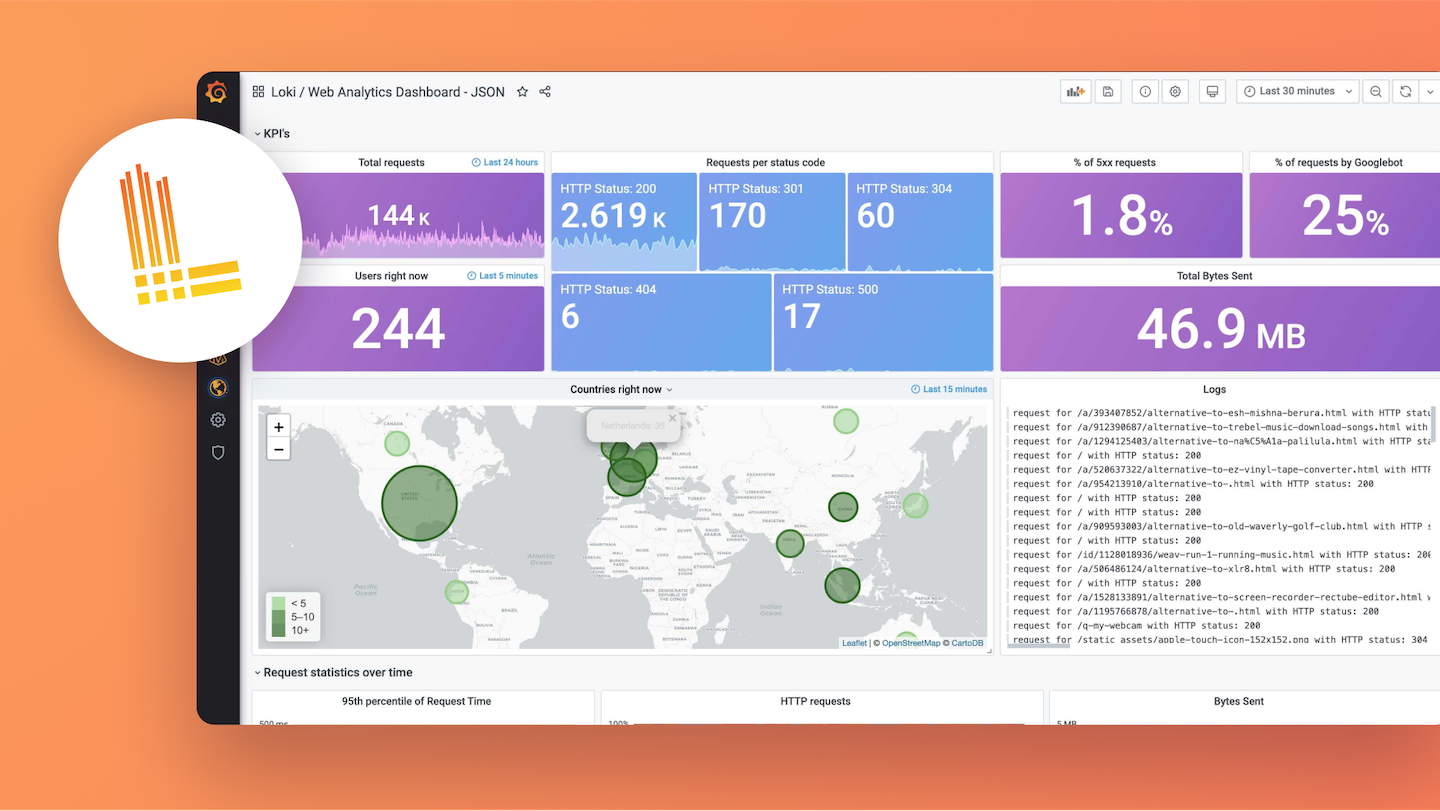
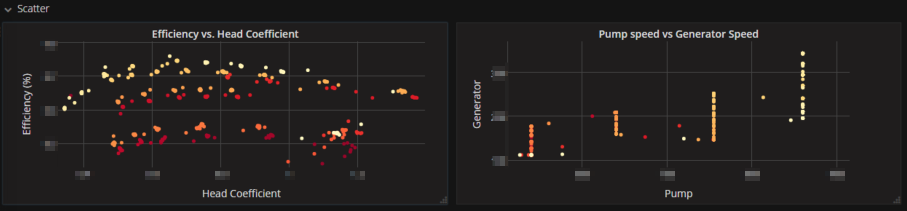
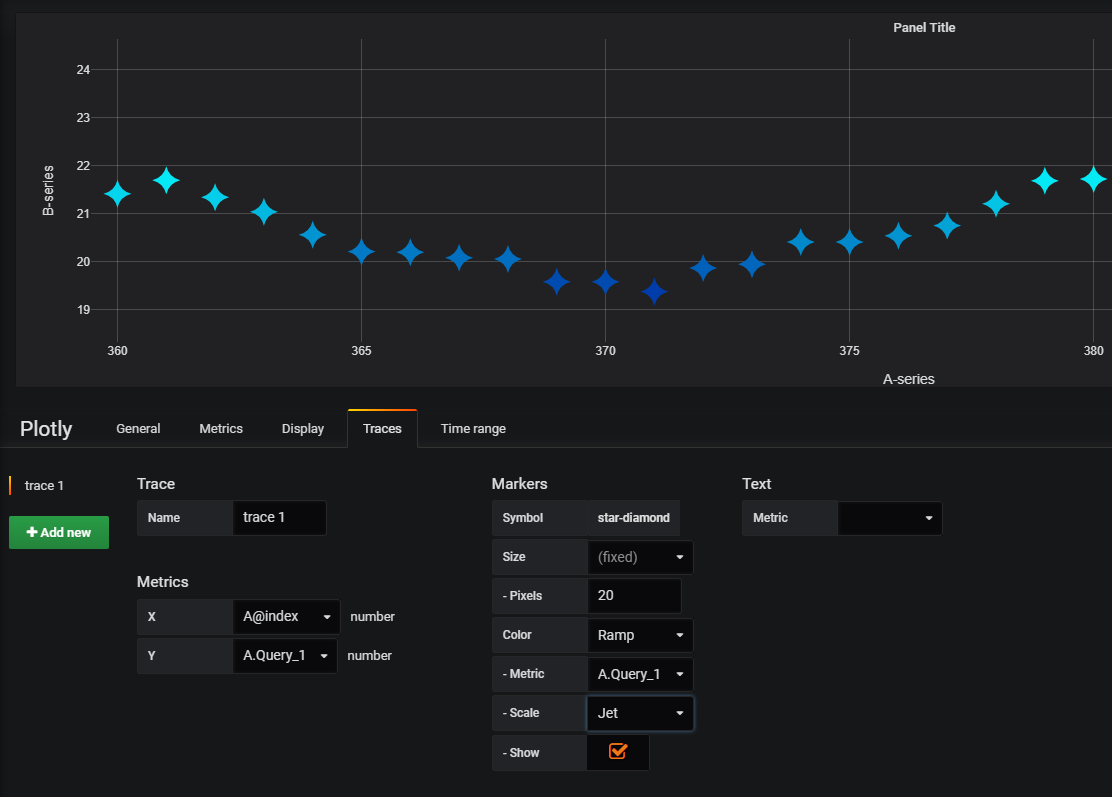
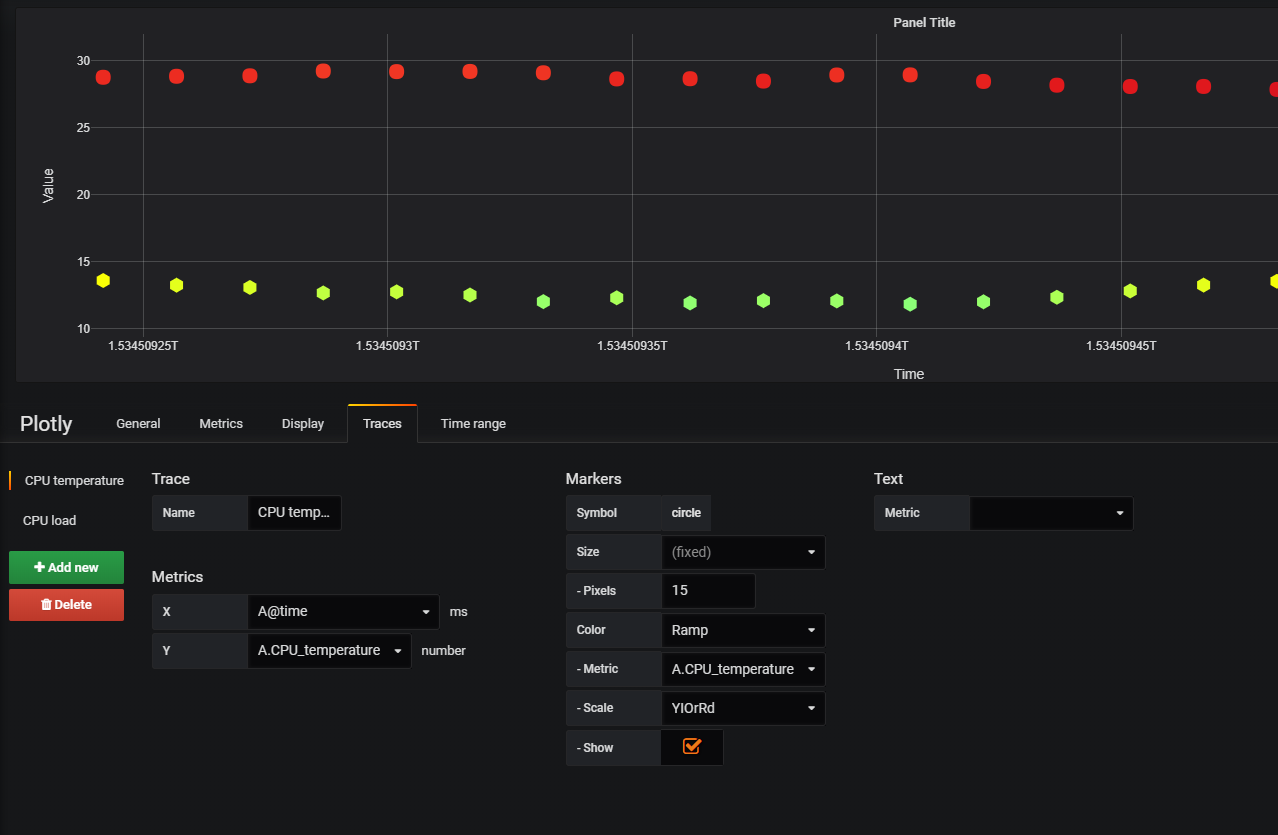
Screenshots
Building
To complie, run:
npm install -g yarn
yarn install --pure-lockfile
yarn build
Releasing
This plugin uses release-it to release to GitHub.
env GITHUB_TOKEN=your_token yarn release-it patch
Changelog
v0.0.6
- Fix axis range configuration bug #49
- Add basic annotations support #57 (tchernobog)
- Improve loading times for plotly.js and support loading from CDN
- Assume date x-axis when 'auto' and the mapping has 'time'
- Support Fixed-Ratio Axes
- Tested with Grafana 6
v0.0.5
- Upgrade plotly (v1.41+)
- Better support for light theme. (#24, @cscheuermann81)
- Support snapshots
- Removing
distfrom master branch - Support of multiple time series's (#9, CorpGlory DevTeam)
- Support showing text from query (#11)
- Template variable support
- Improved metric mapping
- Using webpack and basic jest tests
v0.0.4
- Load plotly from npm (v1.31.2+)
- Convert to TypeScript
- Reasonable behavior when adding single metric
- Formatting with prettier.js
- Support for a single table query
v0.0.3
- Improve options UI
- Added range mode: "tozero" and "nonnegative"
- Map metrics to X,Y,Z and color
- Can now select 'date' type for each axis to support time
- basic support to size marker with data
v0.0.2
- Added ability to set color from a metric query. (#4, @lzgrablic01)
- Show 3D axis names properly
- Fix initalization to work with 4.2+ (isPanelVisible undefined)
v0.0.1
- First working version
Wishlist (help wanted)
- sizeref helper. I think this depends on the data. likely need to find the range and pick a good value? From react?
- nice to have: https://plot.ly/javascript/parallel-coordinates-plot/
Grafana Cloud Free
- Free tier: Limited to 3 users
- Paid plans: $55 / user / month above included usage
- Access to all Enterprise Plugins
- Fully managed service (not available to self-manage)
Self-hosted Grafana Enterprise
- Access to all Enterprise plugins
- All Grafana Enterprise features
- Self-manage on your own infrastructure
Install on Grafana Cloud
Plugins can be installed directly from within your Grafana instance or automated using the Cloud API or Terraform.
Learn more about plugin installationMarketplace plugins
This is a paid plugin developed by a marketplace partner. To purchase an entitlement, sign in first, then fill out the contact form.
Get this plugin
This is a paid for plugin developed by a marketplace partner. To purchase entitlement please fill out the contact us form.
What to expect:
- Grafana Labs will reach out to discuss your needs
- Payment will be taken by Grafana Labs
- Once purchased the plugin will be available for you to install (cloud) or a signed version will be provided (on-premise)
Thank you! We will be in touch.
For more information, visit the docs on plugin installation.
Installing on a local Grafana:
For local instances, plugins are installed and updated via a simple CLI command. Plugins are not updated automatically, however you will be notified when updates are available right within your Grafana.
1. Install the Panel
Use the grafana-cli tool to install Plotly from the commandline:
grafana-cli plugins install The plugin will be installed into your grafana plugins directory; the default is /var/lib/grafana/plugins. More information on the cli tool.
Alternatively, you can manually download the .zip file for your architecture below and unpack it into your grafana plugins directory.
Alternatively, you can manually download the .zip file and unpack it into your grafana plugins directory.
2. Add the Panel to a Dashboard
Installed panels are available immediately in the Dashboards section in your Grafana main menu, and can be added like any other core panel in Grafana.
To see a list of installed panels, click the Plugins item in the main menu. Both core panels and installed panels will appear.